


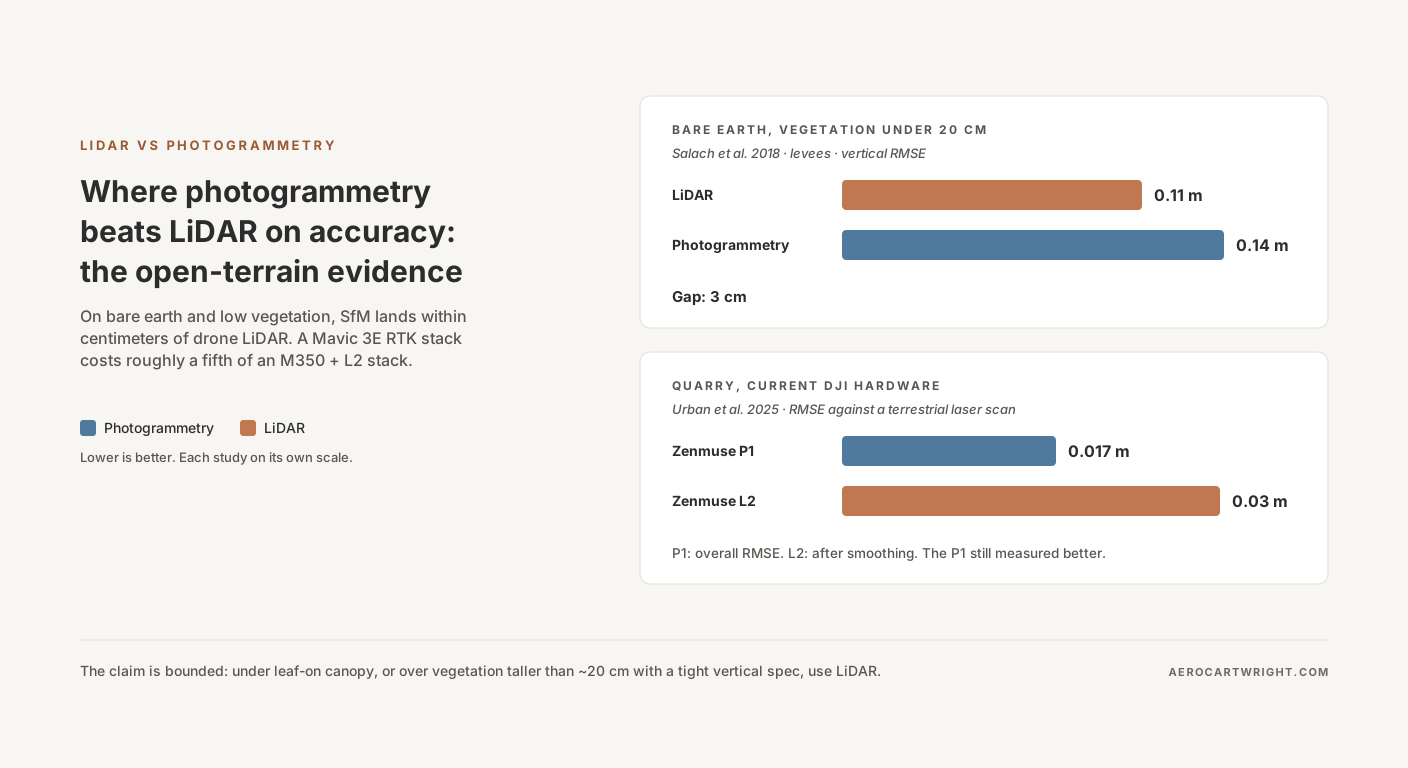
The lidar vs photogrammetry debate usually plays out in slogans. In December 2025, a team from the Czech Technical University in Prague and the Technical University of Košice published the experiment that should have settled the open-terrain half of it. They compared a DJI Zenmuse P1 (photogrammetry) with two Light Detection and Ranging (LiDAR) units — a DJI Zenmuse L1 (previous-generation) and a DJI Zenmuse L2 (current-generation) — in a quarry, against a reference cloud from a Leica P40 terrestrial laser scanner. The photogrammetric cloud’s overall Root Mean Square Error (RMSE) was 0.017 m. Even after smoothing, the L2 reached 0.03 m and the L1 0.05 m (Urban et al. 2025).
Read that again. In that quarry, current-generation drone photogrammetry measured more accurately than current-generation drone LiDAR, and the LiDAR figures are the smoothed ones.
The result isn’t a fluke. It sits on top of an eight-year arc in the peer-reviewed literature. Agüera-Vega 2017 reached 5.8 cm vertical RMSE (RMSEV) with 15 Ground Control Point (GCP) targets. Salach 2018 measured a 3 cm Structure from Motion (SfM) vs LiDAR gap on bare earth and low vegetation (60 checkpoints in that class, 193 overall). Štroner 2023 found the Zenmuse P1 more accurate than the Zenmuse L1 on terrain in leaf-off forest. Tan 2024 found a Real-Time Kinematic (RTK)-equipped Mavic 3 Industrial meeting 1:500 large-scale mapping accuracy with zero GCPs.
So when does the Urban result scale beyond one quarry, and when does it not?
The Sharper Claim: Photogrammetry vs LiDAR on Open Terrain
The literature doesn’t support “photogrammetry beats LiDAR.” It supports a sharper claim. On open-to-low-vegetation terrain, with GCP or RTK control and oblique imagery in the flight plan, SfM photogrammetry matches LiDAR vertical accuracy for roughly a fifth of the hardware capex, and delivers an orthomosaic and textured mesh LiDAR cannot produce.
Step outside those bounds and the comparison flips or both methods fail. Vegetation taller than 20 cm: SfM error climbs fast while LiDAR holds, and by 60 cm the gap is 25 cm. Dense leaf-on or evergreen canopy: LiDAR is the only viable bare-earth option. Wet coal, fresh snow, dark asphalt: SfM’s tie-point matching collapses while LiDAR’s active ranging keeps working. Twilight or under-bridge inspection: photogrammetry needs ambient light it doesn’t have.
The argument is bounded and defensible inside its bounds. The broader head-to-head on workflow complexity, capex, deliverables, and point density lives in the LiDAR vs Photogrammetry comparison hub. This piece is the accuracy chapter.
The Salach Test — The Cleanest Direct Comparison in the Literature
Site, hardware, methodology
The cleanest direct comparison of UAV LiDAR versus SfM in the peer-reviewed record is Salach et al. 2018, published in ISPRS International Journal of Geo-Information (7(9):342). The team surveyed 6.3 km of levees on the east bank of the Vistula River near Annopol, Poland, in May 2017. One platform, a Hawk Moth UAV, carried both sensors: a YellowScan Surveyor LiDAR (180 pts/m²) and a Sony Alpha a6000 with a 16 mm lens. Data were collected at about 50 m above the test area, and the paper reports a 2 cm Ground Sample Distance (GSD) for the imagery.
The methodology is what makes this study load-bearing. The bundle adjustment used 73 GCPs, and the terrain models were validated against 193 independent checkpoints measured by GNSS-RTK across 18 ground profiles. The American Society for Photogrammetry and Remote Sensing (ASPRS) Positional Accuracy Standards, Edition 2 (2023), set the minimum for a fully compliant accuracy assessment at 30 checkpoints and recommend no more than 120, for projects over 10,000 km² (ASPRS / PE&RS, October 2023). Salach’s 193 checkpoints clear that floor overall, but read the table class by class. The checkpoints split unevenly across vegetation classes (60, 91, 31 and 11), so the tallest-vegetation row rests on only 11 points, and Edition 2 tests non-vegetated and vegetated terrain separately rather than as one combined number.
Sample size isn’t how you dismiss the bare-earth row: it rests on 60 checkpoints.
The result
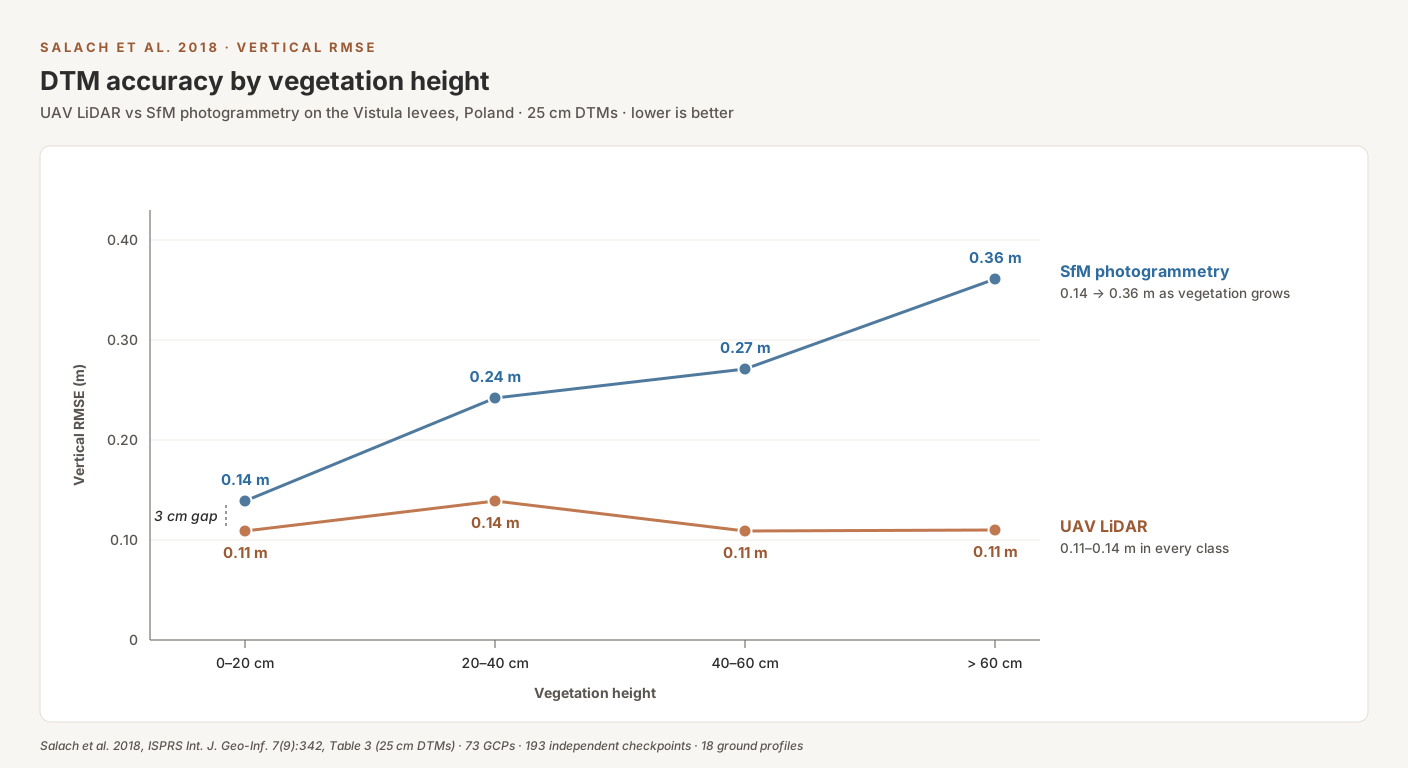
Salach stratified RMSEV by vegetation height. That is the move that makes the dataset honest. Here is the table that anchors the entire series (Table 3 of the paper, 25 cm DTMs, RMSE against the GNSS-RTK checkpoints, rounded to the centimeter):
| Vegetation height | Checkpoints | LiDAR RMSEV | Photogrammetry RMSEV | Gap |
|---|---|---|---|---|
| 0–20 cm | 60 | 0.11 m | 0.14 m | 3 cm |
| 20–40 cm | 91 | 0.14 m | 0.24 m | 10 cm |
| 40–60 cm | 31 | 0.11 m | 0.27 m | 16 cm |
| > 60 cm | 11 | 0.11 m | 0.36 m | 25 cm |
LiDAR stays between 11 and 14 cm RMSEV in every vegetation class. Photogrammetry holds at 14 cm on bare earth and low vegetation — a 3 cm gap — then climbs to 24, 27 and 36 cm. The authors summarize the trend as about 0.10 m of lost accuracy for every 20 cm of vegetation height. Their own table is lumpier than that: the steps are +10, +3 and +9 cm, an average of about 7 cm per class.
What this proves and what it doesn’t
What it proves: on bare earth and vegetation under 20 cm, the LiDAR vertical-accuracy advantage is three centimeters. In the series cost breakdown, the LiDAR stack costs 3.3–4.5× as much per job as a Mavic 3E stack (more on that below). For most engineering deliverables — site grading, drainage to the gutter, construction earthworks on cleared sites — that 3 cm rarely decides the deliverable, and LiDAR is buying accuracy nobody is billing for.
What it doesn’t prove: that photogrammetry is good enough under vegetation. In the 20–40 cm class, SfM RMSEV is already 24 cm against LiDAR’s 14 cm; by 40–60 cm it is 27 cm. ASPRS Edition 2 only sets pass/fail thresholds for non-vegetated terrain; vegetated vertical accuracy is tested and reported as found. That doesn’t rescue the deliverable. A contract asking for a 10 cm vertical class over ground that’s mostly tall grass isn’t getting it from a 24–36 cm surface. The degradation curve is the honest rebuttal to anyone trying to extend the open-terrain claim into riparian corridors or pasture.
The Agüera-Vega Baseline — 5.8 cm Vertical with 15 GCPs
Salach pins the bare-earth comparison. Agüera-Vega et al. 2017 (Measurement 98:221–227) pins what photogrammetry alone delivers with ground control.
The setup: 160 images over a 17.64-hectare site at 120 m above ground level, with five replications of each GCP configuration from 4 to 20 GCPs. At 15 GCPs the horizontal RMSE (RMSEH) was 4.6 cm and RMSEV was 5.8 cm. At 20 GCPs, RMSEV tightened to 4.7 cm.
The study flew no LiDAR, so the comparison has to come from elsewhere. Heliguy’s published test of the Zenmuse L2 at a Komatsu UK site reported a 4.4 cm mean vertical error (the average of 11 checkpoint differences, not an RMSE) at 50 m (Heliguy, DJI reseller). Across the sources in this article, drone LiDAR vertical figures run from 3 cm (L2, Urban, smoothed RMSE in a quarry) to 14 cm (YellowScan Surveyor, Salach, RMSE on levees). Those are different metrics on different sites, so treat the range as a rough envelope, not a like-for-like benchmark. Agüera-Vega’s 4.7–5.8 cm sits inside it, on hardware costing a fraction as much.
That is the entire argument in one sentence. With proper ground control, drone photogrammetry lands at about 5 cm vertical RMSE, inside the range drone LiDAR posts on other sites.
2023–2025 — Current-Hardware Confirmation
Salach and Agüera-Vega are 8–9 years old, which is the standard objection. The counter-argument: hardware has moved on, and current-generation LiDAR such as DJI’s Zenmuse L2 closes the gap. The 2023–2025 literature tests that claim.
Štroner et al. 2023 — P1 out-measures L1 in leaf-off forest, with gaps
Štroner, Urban, Křemen, and Braun (2023), European Journal of Remote Sensing 56(1):2179942, flew the Zenmuse P1 and the Zenmuse L1 over three forested sites in leaf-off conditions, with a Leica P40 terrestrial scanner as ground truth. The abstract reports that branches “pose no problem to the accuracy” of either terrain cloud, and that elevation accuracy for the photogrammetric data was even better than for the LiDAR data, “as low as 0.015 m on all sites.” (The abstract gives no per-site LiDAR figures; this article reports only what the abstract states.)
The catch is coverage. In the very dense young forest, the photogrammetric terrain cloud covered 80.7% of the ground, against almost 100% for LiDAR. Only 11% of the LiDAR ground points at that site came from first returns, which is why multi-return LiDAR keeps its edge under branches. The leaf-off caveat matters too. This isn’t “photogrammetry beats LiDAR under canopy.” It’s “in leaf-off conditions, photogrammetry measured the ground it could see more accurately than the L1, but it saw less of it.” Narrow finding, defensible result.
Urban et al. 2025 — DJI L2 accuracy vs P1 vs L1 in a quarry
Urban et al. 2025 (European Journal of Remote Sensing 58(1):2595361) is the freshest data point in the series and the most directly relevant for anyone evaluating DJI hardware in 2026. The site was a quarry, the kind of exposed, hard surface where photogrammetry should do well. Reference was a Leica P40 terrestrial scanner. Three sensors, as reported in the abstract. Note the two different measures: the abstract gives the P1 as an overall RMSE (RMSE_O) and the L1 and L2 as overall accuracy after smoothing (RMSE_S).
| Sensor | Type | RMSE vs reference (measure) | Noise (RMSE) |
|---|---|---|---|
| Zenmuse P1 | Photogrammetry | 0.017 m (1.7 cm), overall (RMSE_O) | — |
| Zenmuse L2 | LiDAR (current-gen) | 0.03 m (3 cm), after smoothing (RMSE_S) | 0.026 m |
| Zenmuse L1 | LiDAR (previous-gen) | 0.05 m (5 cm), after smoothing (RMSE_S) | 0.045 m |
Two findings matter. First, the L2 closed much of the gap on the L1. DJI’s current LiDAR is genuinely more accurate than the previous generation. Second, the P1 still came out ahead: its overall RMSE of 0.017 m was lower than the L2’s 0.03 m even after the LiDAR cloud was smoothed. The abstract calls the photogrammetric accuracy “still somewhat better.” That is the headline you can defend.
Be fair to the authors, though. Their own conclusion is that the L2’s accuracy “is sufficient for a vast majority of applications” and that new-generation scanning could replace UAV photogrammetry for point clouds in the foreseeable future. Both things are true. Photogrammetry measured better in this quarry, and the L2 is accurate enough that the deciding factor for many jobs is cost and deliverables, not the centimeter.
Tan et al. 2024 — RTK without GCPs
Tan et al. 2024 (Proceedings of SPIE, Fifth International Conference on Geology, Mapping and Remote Sensing) tested the DJI Mavic 3 Industrial in RTK mode, processed in both DJI Terra and Pix4Dmapper. Headline: with no GCPs, output from both packages met the requirements of 1:500 large-scale mapping, with absolute and relative positioning error no greater than 0.05 m and 0.15 m. Additional GCPs did not distinctly improve absolute accuracy.
Pair Tan with Agüera-Vega and the workflow shift is clear, even though the two studies used different sites and different drones. Agüera-Vega 2017 needed 15 GCPs to reach 5.8 cm vertical. Seven years later, Tan’s RTK-equipped Mavic 3 Industrial met 1:500 mapping requirements with none. The classic objection — “photogrammetry needs GCPs everywhere; LiDAR doesn’t” — no longer holds for every job. RTK alone isn’t a free pass everywhere, and the cases where you still need GCPs on top of an RTK drone are covered in RTK drone still needs GCPs (sometimes).
Why Photogrammetry Stays in the Race — Three Mechanisms
Open hard surfaces are where SfM has structural advantages over LiDAR. Three mechanisms explain why.
Texture density
Dense image matching turns every well-textured pixel into a candidate point. In Salach, the photogrammetric cloud from 2 cm GSD imagery ran at about 1,700 points per square meter against 180 pts/m² for the YellowScan LiDAR on the same flight — roughly 9× the density (1,700 ÷ 180 = 9.4). Density isn’t coverage, though: the same paper found the photogrammetric cloud had holes where matching failed in vegetation.
That density translates into surface detail. The orthomosaic, the textured mesh, and the Digital Surface Model (DSM) carry the visual richness of the source imagery. LiDAR returns geometry, not color. The L2 carries a 20 MP RGB mapping camera (DJI specs), so you can colorize the cloud, but the geometric resolution is still the LiDAR’s. The economic case for the orthomosaic a LiDAR-only flight leaves behind gets its own article later in this series.
The doming problem is solved
The standard objection to photogrammetric accuracy is doming: a systematic curvature in the Digital Elevation Model (DEM) where the surface bows like a bowl across the project area. Doming is real. It comes from near-parallel imaging directions in pure nadir flights combined with imperfect radial lens-distortion correction during self-calibration. The bundle adjustment conflates lens distortion with terrain shape.
James and Robson 2014 (Earth Surface Processes and Landforms 39(10):1413–1420) is the definitive paper on the mechanism, and on the fix. Using simulated image networks, they showed that adding oblique imagery to a nadir grid can reduce DEM error by up to two orders of magnitude in the absence of control points. That is a workflow change, not a hardware purchase. Doming is a planning artifact, not an inherent SfM ceiling. The full treatment lives in the doming myth: photogrammetry’s most-cited weakness is a fixable workflow problem.
GCP requirements have shrunk
Agüera-Vega 2017 needed 15 GCPs to reach 5.8 cm vertical RMSE. Tan 2024 met 1:500 mapping accuracy with an RTK Mavic 3 Industrial and zero GCPs. For RTK-capable drones, a lot of open-terrain photogrammetry can now be flown checkpoint-validated rather than control-anchored, and the field time spent setting and surveying GCPs shrinks with it. You still need independent checkpoints to prove the number.
The Cost Reality: Drone Survey Accuracy per Dollar
Accuracy is half the story. The other half is what each method costs per acre and per job.
| Method | Quoted price | Per acre |
|---|---|---|
| Drone photogrammetry, standard mapping | $150–$300 per acre | $150–$300 |
| Drone LiDAR | $150–$500 per acre, depending on point density | $150–$500 |
| Traditional topographic survey | $15,000–$30,000 for a 20-acre site | $750–$1,500 |
Source: TheFuture3D drone survey cost guide (service provider), checked 2026-10-02. The per-acre figure for the ground survey is the site price divided by 20 acres ($15,000 ÷ 20 = $750; $30,000 ÷ 20 = $1,500). The drone ranges overlap; at the top end, LiDAR runs up to 1.7× the photogrammetry rate ($500 ÷ $300). A traditional survey runs 2.5–10× the drone photogrammetry rate ($750 ÷ $300 to $1,500 ÷ $150).
Hardware is where the gap widens. In the series cost breakdown, priced at October 2026 dealer listings after the Section 232 drone tariffs took effect on 2026-09-03 (CBP CSMS #69738151), a Mavic 3E RTK stack runs $5,806–$8,505 and a Matrice 350 + Zenmuse L2 stack runs $37,609–$40,843. Several of those items are already at the end of their run: Global Drone HQ lists the Mavic 3 Enterprise as discontinued in favor of the Matrice 4E, and says the Zenmuse L2 “is no longer available,” pointing to the Zenmuse L3 (reseller). That puts the photogrammetry stack at 14–23% of the LiDAR stack’s capex ($5,806 ÷ $40,843 = 14%; $8,505 ÷ $37,609 = 23%). Over five years at 100 jobs per year, the same breakdown puts a Mavic 3E with Agisoft Metashape Professional at about $27 per job, the M350 + L2 at $89 with DJI Terra only and $123 with LP360 added. That is a $62–$95 per-job LiDAR premium before processing labor, and 3.3–4.5× the photogrammetry cost per job ($89.17 ÷ $27.41 = 3.3; $122.67 ÷ $27.41 = 4.5). The series cost breakdown sets out every assumption, including resale value, insurance and software, at 50, 100 and 200 jobs per year.
Where LiDAR Genuinely Wins
The non-negotiable section. The contrarian position only holds if the boundary is honest. Five scenarios put the open-terrain argument out of bounds, and in those scenarios LiDAR is the right tool. Full stop.
-
Dense leaf-on or evergreen canopy. Wallace et al. 2016 (Forests 7(3):62) tested SfM in a eucalypt forest plot against UAV laser scanning flown on the same multirotor, and found SfM recovered far fewer ground points under tree crowns (about 0.5 against 2 points/m²). Under the canopy, its terrain model differed from the LiDAR terrain by more than 0.5 m in places. The paper sets no viability threshold; 50–60% canopy cover is a common rule of thumb, not a published limit. Leaf-on versus leaf-off timing gets its own article later in this series.
-
Powerline corridor multi-return work. Separating conductor wire from vegetation below requires multi-return laser geometry. Photogrammetry struggles to resolve thin wires against complex backgrounds, because tie-point matching has little to grip on a thin, featureless conductor.
-
Textureless surfaces. Wet coal, fresh sand, dark uniform asphalt, monochrome industrial floors, standing water, fresh snow. SfM tie-point matching requires texture. Where texture isn’t there, photogrammetry produces sparse or interpolated point clouds that look like data and aren’t. The stockpile edge case (textured aggregate to photogrammetry, textureless material to LiDAR) is covered later in this series.
-
Low-light environments. Civil twilight, bridge undersides, indoor industrial spaces. Photogrammetry needs ambient light; LiDAR carries its own.
-
Bare-earth Digital Terrain Models (DTMs) under leaf-on or evergreen cover. Hydrology, FEMA floodplain mapping, drainage modeling, riparian-corridor engineering. If the deliverable is “ground beneath whatever is growing on it,” photogrammetry is the wrong sensor. Leaf-off deciduous stands are the exception, as the Štroner result above shows; where the canopy never opens, the camera never sees the ground.
Inside that boundary, the photogrammetry argument is defensible. Outside it, buy LiDAR.
The Decision Framework: When to Use LiDAR Drone vs Photogrammetry
Three questions decide the call.
-
What’s on the ground, and what’s overhead? Bare ground or vegetation under 20 cm: photogrammetry, with a 3 cm RMSEV penalty in Salach. Grass and crops taller than 20 cm: the SfM penalty jumps to 10 cm and keeps growing, to 25 cm above 60 cm, so plan on LiDAR when the vertical spec is tight. Trees: decide by leaf state, not a cover percentage. Leaf-on or evergreen canopy goes to LiDAR. Leaf-off deciduous stands can work for photogrammetry, but expect coverage holes where branches are dense (80.7% coverage in Štroner’s densest site).
-
Deliverable? Orthomosaic + DSM + textured mesh: photogrammetry by default. Bare-earth DTM under vegetation for hydrology, FEMA, or drainage: LiDAR. Both required: fly a LiDAR payload with an integrated RGB mapping camera, such as the Zenmuse L2, and run both pipelines on the same flight.
-
Budget reality at 100 jobs per year? In the series cost breakdown, LiDAR adds $62–$95 per job over five years before processing labor. If the typical job ticket absorbs that against a photogrammetry-flying competitor, LiDAR is fine. If it doesn’t, the client is paying for accuracy the deliverable never needed.

Series Roadmap
This article leads a seven-part series called “When LiDAR Loses.” Each sibling takes one dimension of the comparison and goes deep. The LiDAR premium breaks down hardware, software, and per-job amortization across 50/100/200 jobs per year. The doming myth walks through James & Robson 2014 and the oblique-imagery fix. The orthomosaic and textured-mesh deliverables LiDAR can’t produce get their own treatment, as does the volumetric case on textured aggregate (and the textureless exceptions). A leaf-on vs leaf-off article treats the canopy question honestly, including why leaf-off deciduous forest is the exception. Facade, bridge-underside, and low-light cases where LiDAR earns its premium close the series. Every article links back to the LiDAR vs photogrammetry pillar.
Bottom Line
The literature doesn’t support “photogrammetry beats LiDAR overall.” It supports a sharper claim. On open-to-low-vegetation terrain, with GCP or RTK control plus oblique imagery, SfM photogrammetry matches LiDAR vertical accuracy for roughly a fifth of the hardware capex, and delivers an orthomosaic and textured mesh LiDAR cannot produce.
The claim is bounded, and the bounds matter. Use LiDAR under leaf-on or evergreen canopy, over vegetation taller than about 20 cm when the vertical spec is tight, on textureless surfaces, or when you need bare earth under vegetation. For open terrain and hard surfaces, photogrammetry meets the spec for a fraction of the cost.
The contrarian position isn’t “LiDAR is overhyped.” It’s narrower than that. LiDAR is the right tool for about five specific job types. For everything else, you’re paying a premium for a deliverable the client never asked for.
Sizing a sensor stack against your actual job mix, or scoping a project where the photogrammetry-versus-LiDAR call is non-obvious? Get in touch.
References
Research and standards cited in this article.
- Agüera-Vega, F., Carvajal-Ramírez, F., & Martínez-Carricondo, P. (2017). Assessment of photogrammetric mapping accuracy based on variation ground control points number using unmanned aerial vehicle. Measurement, 98, 221–227. doi:10.1016/j.measurement.2016.12.002
- ASPRS. (2023). ASPRS positional accuracy standards for digital geospatial data (Edition 2). Photogrammetric Engineering & Remote Sensing, 89(10), 589–592. doi:10.14358/PERS.89.10.589
- James, M. R., & Robson, S. (2014). Mitigating systematic error in topographic models derived from UAV and ground-based image networks. Earth Surface Processes and Landforms, 39(10), 1413–1420. doi:10.1002/esp.3609
- Salach, A., et al. (2018). Accuracy assessment of point clouds from LiDAR and dense image matching acquired using the UAV platform for DTM creation. ISPRS International Journal of Geo-Information, 7(9), 342. doi:10.3390/ijgi7090342
- Štroner, M., et al. (2023). UAV DTM acquisition in a forested area – comparison of low-cost photogrammetry (DJI Zenmuse P1) and LiDAR solutions (DJI Zenmuse L1). European Journal of Remote Sensing, 56(1), 2179942. doi:10.1080/22797254.2023.2179942
- Tan, C., et al. (2024). Accuracy assessment of Mavic 3 Industrial UAV based on DJI Terra and Pix4Dmapper. Fifth International Conference on Geology, Mapping, and Remote Sensing (ICGMRS 2024), Proceedings of SPIE 13223. doi:10.1117/12.3035344
- Urban, R., et al. (2025). Testing the accuracy and characteristics of data acquired using DJI Zenmuse L1 and L2 lidar systems and photogrammetric data acquired using DJI Zenmuse P1 in a quarry environment. European Journal of Remote Sensing, 58(1), 2595361. doi:10.1080/22797254.2025.2595361
- Wallace, L., et al. (2016). Assessment of forest structure using two UAV techniques: A comparison of airborne laser scanning and structure from motion (SfM) point clouds. Forests, 7(3), 62. doi:10.3390/f7030062