



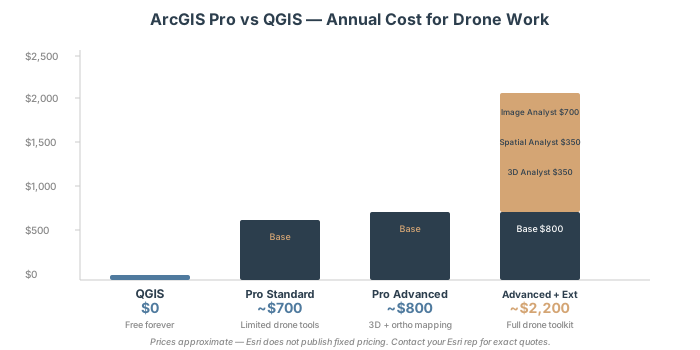
Updated October 2026: We replaced estimated license prices with Esri US Store list prices (Creator $700, Professional $2,200 and Professional Plus $4,200 a year; extensions $650 a year each), which also showed that Creator plus extensions can cost less than Professional Plus; corrected the Drone2Map requirements (Creator, Professional or Professional Plus, no published price); moved NDVI to the Band Arithmetic raster function, which needs no extension; corrected which extensions the contour, slope, volume and raster calculator tools need, and gave the 3D Analyst menu paths alongside the Spatial Analyst ones; replaced the ArcGIS Online cost figures with Esri’s credit rates; added that LAZ support arrived in ArcGIS Pro 3.6, with direct LAZ use planned for 3.8, and that the Convert LAS fallback needs 3D Analyst or Spatial Analyst on Creator; and corrected the QGIS comparison, which has native 2D and 3D point cloud display and a built-in raster volume tool.
You processed your drone survey in WebODM or Pix4D. You have an orthomosaic, a point cloud, and a DSM sitting on your drive. Now what? If your organization runs ArcGIS or your client expects ArcGIS deliverables, you need to import your drone data into ArcGIS Pro. Here’s the complete workflow.
You’ll import orthomosaics, load point clouds for 3D analysis, run volume calculations, generate contours, detect change between surveys, and publish everything to ArcGIS Online so your client can access results from a browser without owning GIS software.
This is where ArcGIS Pro earns its license. Processing is done elsewhere — but analysis and delivery happen here.
What ArcGIS Pro Accepts (And What It Doesn’t)
Your drone software outputs files in standard formats. ArcGIS Pro recognizes most of them. But three gotchas will catch you if you don’t understand the format rules first.
Rasters (Orthomosaics, DSM, DTM)
Import orthomosaics and elevation rasters directly:
| Format | Support | Notes |
|---|---|---|
| GeoTIFF (.tif, .tiff) | Full | Industry standard. Coordinate system embedded, compression optional. Start here. |
| Cloud Raster Format (.crf) | Full | Esri proprietary format. Converts automatically from GeoTIFF. Faster load times for large files. |
| MrSID | Full | Legacy format, still used. Supported natively in current ArcGIS Pro versions. |
| ERDAS IMAGINE (.img) | Full | Supported but unnecessary. GeoTIFF better practice. |
Import process: Drag-and-drop the .tif into your map, or use Catalog → Add Data. ArcGIS Pro detects the coordinate system automatically. If your orthomosaic uses a projected CRS (UTM, State Plane) and your project uses a different CRS, Pro reprojects on-the-fly without modifying the source file.
Point Clouds (LAS, LAZ, E57)
This is where most operators trip.
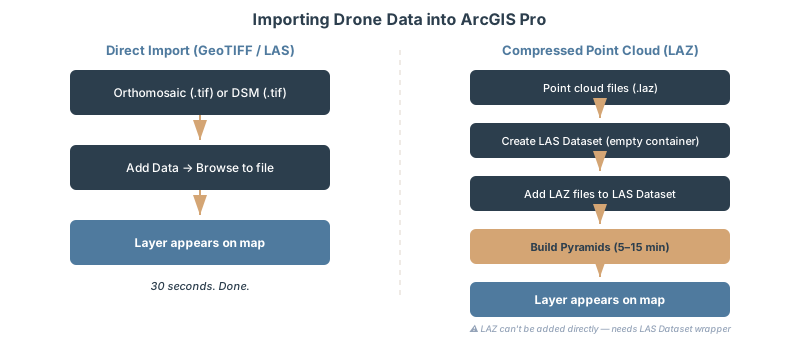
LAS (.las) — Direct import works. Drag the file into a map and ArcGIS Pro creates a point cloud layer. You get basic visualization and filtering.
LAZ (.laz) — Compressed format, smaller files, same 3D accuracy. But you cannot import it directly into a map. You must create a LAS dataset first, add the LAZ file to the dataset, then add the dataset as a layer. Esri’s documentation is explicit: you cannot see individual .laz files in the Catalog pane or drag them to a map, so they must be added to a LAS dataset (Esri: data supported by a LAS dataset). A LAS dataset can reference LAZ files from ArcGIS Pro 3.6 on; on older versions, convert LAZ to LAS with the Convert LAS tool first (on Creator, which runs ArcGIS Pro Basic, that tool needs the 3D Analyst or Spatial Analyst extension).
Dated note (October 2026): Esri says direct LAZ use, without the LAS dataset step, is underway and planned for ArcGIS Pro 3.8, with planned availability in November 2026 (Esri Community, “Support for .LAZ”). Until you are on 3.8, use the LAS dataset workflow below.
E57 — Supported in ArcGIS Pro 3.2 and later. Direct import. Useful if your photogrammetry software exports E57 natively (some do).
The workflow for LAZ files:
- Open Catalog
- Right-click a project folder → New → LAS Dataset (a LAS dataset is a .lasd file in a folder, not a geodatabase item)
- Click OK (creates an empty dataset)
- Right-click the LAS dataset → Add Files
- Select your .laz files (you can add multiple at once)
- Click Add
- Now drag the LAS dataset into your map as a layer
Set up pyramids immediately after adding files. Pyramids are spatial indexes that tell ArcGIS Pro where points are in 3D space before it loads all 50 million of them. A flight with 500 MP photos can easily produce 30–50 million points. Without pyramids, panning the 3D view feels like wading through concrete.
Right-click the LAS dataset → Build Pyramids → click OK. This runs once, takes 5–15 minutes depending on point count, and saves you hours of frustration.
Display limits: By default, ArcGIS Pro shows a maximum of 4 million points on screen. This limit is configurable but changing it won’t help you—it’s a performance ceiling, not an arbitrary restriction. If you’re working with 50 million points, Pro down-samples what you see in real-time while preserving the full dataset for analysis.
3D Models (Scene Layer Packages, OBJ, USDZ)
Scene Layer Packages (.slpk) are Esri’s native format for 3D models in ArcGIS. They compress and tile data for web delivery.
Export your point clouds or textured meshes as OBJ from your photogrammetry software, then convert to SLPK using Esri’s online conversion tool or ArcGIS Pro’s CityEngine integration.
For client delivery, SLPK is what you want — it streams efficiently over the web and doesn’t require clients to download gigabyte-sized files.
Multispectral Rasters
If your drone carries multispectral sensors — agricultural operators, environmental monitoring, vegetation analysis — your raster will have multiple bands: Red, Green, Blue, NIR (near-infrared).
Import the same way as orthomosaics. ArcGIS Pro reads the band structure from the GeoTIFF metadata. You’ll calculate NDVI (Normalized Difference Vegetation Index) later using Band Arithmetic — that gets its own section.
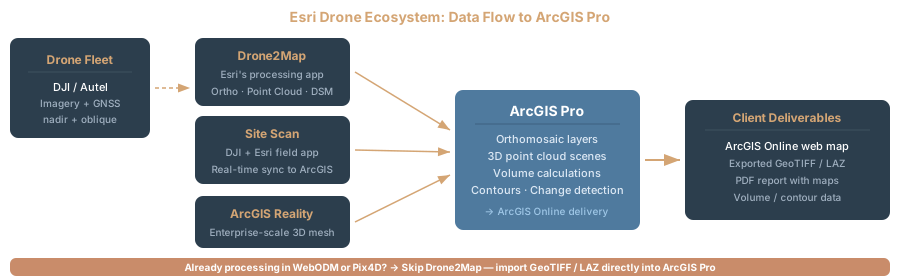
The Esri Drone Ecosystem: Which Tool for Which Job?
Esri offers multiple products for drone workflows. They’re not all the same. Confusion is normal.
Drone2Map for ArcGIS
Drone2Map is a desktop photogrammetry application now powered by the ArcGIS Reality Engine (originally built on Pix4D’s engine, but Esri transitioned to their own processing core starting in 2022, fully implemented in Drone2Map 2025.1). You feed it raw drone images. It outputs orthomosaics, point clouds, DSMs, and textured 3D models.
Licensing: Drone2Map is licensed separately from ArcGIS Pro. Esri assigns Drone2Map licenses only to members with a Creator, Professional or Professional Plus user type; through the 2025 releases the license levels are Drone2Map Standard and Advanced, and Esri says Drone2Map 2026.1 moves to a single Reality Mapping license (Esri: manage Drone2Map licenses). Esri’s online store lists no Drone2Map price, so get a quote from Esri or a distributor.
Should you use it? Only if you process images inside ArcGIS Pro and want a unified workflow. If you already process images in WebODM, Pix4D, or Metashape and just need to import results, skip Drone2Map entirely. You’re paying for redundant software.
Site Scan for ArcGIS
Enterprise-level drone program management. Flight planning, automated dispatches, fleet management, cloud-based processing, regulatory compliance dashboards. For large organizations running dozens of drone flights per month across multiple sites.
Custom pricing. Enterprise clients only. This is overkill for small operations.
ArcGIS Reality Extension
Adds advanced 3D capabilities to ArcGIS Pro: true orthomosaics (camera angles corrected for perspective distortion), dense point clouds with lower noise, textured 3D meshes, and Gaussian splatting (new in 2025).
Cost: Separate extension license on top of your ArcGIS Pro user type, and Esri limits these ArcGIS Reality for ArcGIS Pro capabilities to Professional and Professional Plus user types (Esri). The online store lists no price; ask Esri for a quote. It’s not the entry point for basic drone workflows. Use this if you’re doing photogrammetry processing inside Pro (not the typical case).
Decision Tree
If you process images in WebODM / Pix4D / Metashape: Import results directly into ArcGIS Pro. Done.
If you want photogrammetry processing built into Pro: Use Drone2Map or Reality extension.
If you’re an enterprise with dozens of flights per month: Site Scan might make sense.
For 95 percent of practitioners reading this, you process images elsewhere and import the deliverables. Drone2Map is not your answer.
How to Import Drone Data Into ArcGIS Pro
Orthomosaic (GeoTIFF)
Your photogrammetry software exported a georeferenced GeoTIFF. It includes coordinate system information in the file metadata.
- Create a new ArcGIS Pro project with the correct coordinate system (UTM Zone 15N, State Plane Ohio South, WGS 84 — whatever matches your survey area)
- Open the Map view
- Go to Map → Add Data (or right-click the map → Add Data)
- Browse to your .tif file, select it, click OK
- The orthomosaic appears on the map with automatic projection
If the file was projected to UTM and your project uses Web Mercator, Pro reprojects on-the-fly. The source file stays untouched.
Before analysis: Always project your data to match your project CRS. Do not rely on on-the-fly reprojection for analysis tools. Some tools require explicit projection.
Point Cloud (LAS File)
- Open Catalog (View → Catalog pane)
- Right-click a project folder → New → LAS Dataset
- Accept defaults. This creates an empty LAS dataset.
- Drag your .las file onto the LAS dataset in Catalog (or right-click the dataset → Add Files → select .las)
- Right-click the LAS dataset → Build Pyramids → OK (wait 5–15 minutes)
- Drag the LAS dataset into your map
You now have a point cloud layer. Open the Appearance tab (with the layer selected) to adjust point size, color ramp (Elevation, Intensity, Classification), and point density.
Critical setting: Classification filter. If your point cloud is classified (ground, vegetation, buildings — standard from any modern photogrammetry software), filter to “Ground” to reduce visual clutter. Drag the Density slider down if the point cloud is choking your display.
DSM/DTM Raster
Same as orthomosaic. Drag the .tif into the map. Done.
Use the Raster Functions tab to apply on-the-fly stretch (Percent Clip, Stretch, Equalize) so you can see elevation variation clearly. But do not modify the source file.
Coordinate Systems and Vertical Datums
Horizontal: ArcGIS Pro handles reprojection automatically. Your orthomosaic came out of photogrammetry in geographic coordinates (WGS 84). Your project might use UTM or State Plane. Pro will reproject. No problem.
Vertical: This is where people get lost. Your point cloud has a vertical datum—WGS 84 ellipsoid (the mathematical surface the satellite system uses) or NAVD 88 (the official US vertical reference). These differ by roughly 72–174 feet across the CONUS depending on location.
Check your point cloud’s metadata before importing. If it says “WGS 84 ellipsoid” and your project expects “NAVD 88,” your elevations are off by the geoid separation at that location — commonly 80–120 feet in the continental US.
If they don’t match, you have two choices: (1) reproject the point cloud in your photogrammetry software before import, or (2) apply a vertical datum transformation in ArcGIS Pro. The second option is easier.
In your map properties (Map → Map Properties), set the vertical coordinate system explicitly. ArcGIS Pro will calculate and apply the geoid separation automatically. Your point cloud will align with your NAVD 88 project.
Five Analysis Workflows Every Drone Operator Should Know
Now comes the work that makes the data valuable.
Workflow 1: Volume Calculations (Cut/Fill Analysis)
Use case: Stockpile monitoring, excavation progress tracking, topographic change measurement.
Tools: Cut Fill (3D Analyst or Spatial Analyst) for comparing two surfaces, or Surface Volume / Polygon Volume (3D Analyst) for single-surface volume against a reference plane. For raster-based cut/fill with imagery: Calculate Cut Fill Volume (Image Analyst extension).
Input: DSM raster + polygon boundary (or two DSM rasters for change detection)
Process:
- Open your DSM as a raster layer
- Create a polygon feature (digitize or import your site boundary)
- For two-date comparison: 3D Analyst → Area and Volume → Cut Fill (before surface, after surface); with Spatial Analyst instead, it’s Spatial Analyst → Surface → Cut Fill
- For single-surface volume: 3D Analyst → Area and Volume → Surface Volume (specify reference plane elevation)
- Output: numerical volume in cubic feet or meters, depending on your CRS
Example: A stockpile site photographed on Jan 15 and Feb 20. Set January’s DSM as your baseline. Subtract the January DSM from the February DSM to show the volume of material added (positive) or removed (negative).
Practical tip: Use a measured surveyed point as your reference elevation, not an estimated ground level. A 1-foot error in baseline elevation swings your volume number by thousands of cubic yards on large sites.
Workflow 2: Contour Generation (Topographic Lines)
Use case: Engineering deliverables, site grading plans, environmental reports.
Tool: Contour (Spatial Analyst or 3D Analyst extension; either one licenses the tool)
Input: DSM or DTM raster
Process:
- Select your elevation raster (DSM or DTM)
- Go to 3D Analyst → Raster → Surface → Contour (or Spatial Analyst → Surface → Contour if that’s the extension you have)
- Set contour interval (1 foot for construction, 5 feet for topographic mapping)
- Run the tool
- Output: vector polyline feature class (contour lines)
Settings that matter:
- Contour field type: Elevation (pro tip: include the elevation value on each line for client maps)
- Base contour: Start at 0 or the minimum elevation in your dataset
- Contour interval: 1 ft for construction sites, 2 ft for finer detail, 5 ft for overview maps
Example: A 40-acre site needs grading plans. You run Contour with 1-foot intervals on your DSM. Output is 400+ contour polylines at 1-foot elevation steps. Export as SHP or GeoJSON and send to the civil engineer. They trace proposed grading against your contours.
Workflow 3: NDVI (Vegetation Index) from Multispectral
Use case: Agricultural monitoring, environmental assessment, vegetation health tracking.
Tool: Band Arithmetic raster function, NDVI method. Esri lists Band Arithmetic and the NDVI raster function as available with ArcGIS Pro Basic, so no extension is needed (Esri: list of raster functions). Image Analyst adds the Raster Calculator and classification tools, but plain NDVI doesn’t need it.
Input: Multispectral raster with Red and NIR bands
Process:
- Import your multispectral raster (GeoTIFF with 4+ bands)
- Open the Imagery tab → Raster Functions → Band Arithmetic
- Set Method to NDVI, which computes (NIR − Red) / (NIR + Red)
- Enter the band indexes in the order NIR Red, for example
4 3. Check your sensor’s band order; it varies by camera and export - Run. Output: raster layer with NDVI values ranging -1 to +1 (Esri: Band Arithmetic function)
Interpreting the output:
- NDVI < 0.2: Non-vegetated (water, pavement, soil)
- NDVI 0.2–0.4: Sparse vegetation (shrubs, stressed crops)
- NDVI 0.4–0.7: Healthy vegetation (crops, dense grass)
- NDVI > 0.7: Dense vegetation (forest, wetland)
Color-code the output raster with a green palette (low NDVI = brown, high NDVI = dark green) and you have a publishable vegetation map.
Workflow 4: Change Detection Between Surveys
Use case: Construction progress, erosion monitoring, environmental change.
Tool: Raster Calculator
Input: DSM from Survey 1 and DSM from Survey 2 (same area, different dates)
Process:
- Open both DSM rasters in your map
- Go to Spatial Analyst → Map Algebra → Raster Calculator (requires Spatial Analyst or Image Analyst)
- Enter formula: DSM_Feb - DSM_Jan
- Run. Output: raster where positive = elevation gain (fill), negative = elevation loss (cut)
Without either extension, the Arithmetic raster function (subtract method), which Esri lists under ArcGIS Pro Basic, produces the same difference raster.
Next step: Classify the output raster to make it readable. Reclassify values into categories: -5 to 0 feet = minor loss, 0–2 ft = stable, 2–10 ft = significant gain, 10+ ft = major fill.
Example: A construction site monitored monthly. January DSM minus December DSM shows November’s excavation progress (negative values = dirt removed). February DSM minus January DSM shows December’s progress. Trend the volumes over time to track schedule impact.
Workflow 5: Slope and Aspect (Terrain Analysis)
Use case: Stability assessment, land planning, visualization.
Tool: Slope and Aspect (Spatial Analyst or 3D Analyst; the Slope, Aspect and Hillshade raster functions also work in ArcGIS Pro Basic for display)
Input: DSM or DTM raster
Process:
- Select your elevation raster
- Go to 3D Analyst → Raster → Surface → Slope or Aspect (or Spatial Analyst → Surface → Slope or Aspect)
- Output units: degrees or percent (degrees is standard)
- Run
Slope output is a raster where cell values = slope steepness at that location. Aspect output is a raster where values = downslope direction (0–360 degrees).
Combine them: hillshade (for visualization) + slope (for analysis) = intuitive terrain maps. Color-code slope by steepness. Steep areas (40+ degrees) in red, moderate (20–40) in orange, gentle (0–20) in green.
Point Cloud Performance: Handling 50 Million Points Without Crashing
Large point clouds will kill your workflow if you don’t know the performance rules.
Scenario: A 500-acre site photographed at 200 feet altitude with a 48 MP camera produces 45–50 million points. Load all 50 million into your 3D view and ArcGIS Pro will slow to a crawl.
How Pro handles this: By default, it applies a display limit of 4 million points visible on-screen. It sub-samples (renders every Nth point) to stay under that limit. The full dataset exists — you can run analysis on all 50 million — but you only see a fraction of them in the 3D view.
Your job is to make this fast:
-
Build pyramids immediately after adding the LAS dataset. Pyramids are spatial indexes. Pro knows where points are without loading everything into memory. This is non-negotiable.
-
Subdivide very large files. If your .las file exceeds 500 MB uncompressed, consider splitting it into tiles before import. Use CloudCompare or LAStools to cut the file into 100–200 MB chunks, then add all chunks to the same LAS dataset. Pro re-indexes them as a unified dataset but queries them independently.
-
Use the Density slider in the Appearance pane. Set it to 20–50 percent for initial navigation, then increase to 100 percent for detailed analysis.
-
Filter by Classification. If the point cloud is classified (ground, vegetation, building, etc.), hide non-essential classes. Ground only = 60 percent fewer points on-screen.
-
Store data on local NVMe SSD, not network drives. Network I/O is slow. SSD speed matters for large point clouds. A 50 MB/s network drive will feel frozen. A 500 MB/s NVMe SSD feels responsive.
-
Switch to 2D map view for detailed work. The 2D map performs faster than 3D view. Use 2D for classification, filtering, and analysis. Switch to 3D only for visualization and client presentations.
Reality check: A 50-million-point cloud takes time to load fully—5–10 minutes of initial indexing is standard. Plan for this in your project schedule. Start processing it while handling other tasks, not as a blocking step.
Publishing to ArcGIS Online (Client Delivery)
After analysis, your client needs results. Publish your orthomosaics, point clouds, and analysis layers as web services to ArcGIS Online. Clients view everything in a browser—no software required.
Publishing Orthomosaics as Tile Layers
- With your orthomosaic layer selected in the Contents pane
- Share → Publish Web Layer
- Choose layer type: “Tile layer” (fast, cacheable, good for basemaps)
- Follow the wizard
- Configure sharing: “Everyone (public)” or “Organization” or specific groups
- Publish
ArcGIS Online creates a cached tile layer — essentially a map broken into 256×256-pixel tiles at multiple zoom levels. Clients pan and zoom instantly. Cost: Esri bills tile and file storage at 1.2 credits per GB per month and tile generation at 1 credit per 10,000 tiles (Esri: credits). At the US Store list price of $120 per 1,000 credits, a GB of tiles costs about 14 cents a month to store.
Publishing Point Clouds as Scene Layers
Point clouds need special handling — scene layers, not tile layers.
- Export your point cloud to LAS or E57 format
- Convert to Scene Layer Package (.slpk) — Esri online tool or Pro’s own conversion
- Upload to ArcGIS Online
- Share
Scene layers stream 3D data efficiently over the web. Clients see the point cloud in their browser without downloading gigabytes.
Creating a Web Scene
A web scene combines all your deliverables: orthomosaic (basemap), contours (overlay), point cloud (3D visualization), and site boundary (polygon).
- In ArcGIS Online, create a new web scene
- Add your published orthomosaic as the basemap
- Add your contour layer as an overlay
- Add your point cloud as a 3D layer
- Configure pop-ups, filters, and legend
- Share via link
Your client opens the link. They see the orthomosaic, can view contour lines, toggle the point cloud on/off, and measure distances. Full interactivity, zero software needed.
Sharing options: Anyone with the link can view. Or restrict to your organization. Or specific users. You control everything.
Licensing: What You Actually Need
Esri’s online store sells ArcGIS Pro through ArcGIS Online user types: a license assigned to one named person, not a floating license shared among several people. Here’s what matters for drone operators.
User Types and Costs
User types (annual subscription, Esri US Store list prices as of October 2026):
- Creator (ArcGIS Pro Basic) — basic mapping, editing, analysis: $700/year
- Professional (ArcGIS Pro Standard) — advanced analysis, more tools: $2,200/year
- Professional Plus (ArcGIS Pro Advanced) — everything above plus the main extensions: $4,200/year
These are the prices the Esri Store quotes for US online purchases; check it before you buy, because list prices change. ArcGIS for Personal Use is $100/year, for noncommercial use only, so it doesn’t cover client work. Esri also runs nonprofit, education and government programs; ask your Esri representative or distributor what applies.
Extensions and Bundling
Professional Plus bundles the key extensions. The Professional Plus user type (ArcGIS Pro Advanced) includes 3D Analyst, Spatial Analyst and Image Analyst — the three extensions drone operators reach for most — along with Geostatistical Analyst, Network Analyst, Data Reviewer, Publisher and Workflow Manager. You do not purchase these separately if you buy Professional Plus.
If you buy a lower tier (Creator or Professional), you add extensions individually. The Esri US Store lists each of these at $650/year (October 2026):
| Extension | List price (Esri US Store, Oct 2026) | What It Adds for drone work |
|---|---|---|
| 3D Analyst | $650/year | 3D analysis, Surface Volume, Cut Fill, Contour, Slope |
| Spatial Analyst | $650/year | Cut Fill, Contour, Slope/Aspect, Raster Calculator, surface analysis |
| Image Analyst | $650/year | Calculate Cut Fill Volume, Raster Calculator, classification and deep learning tools |
Realistic cost for drone work: Do the math against the list prices. Creator plus all three extensions is $2,650/year, well under Professional Plus at $4,200. Professional plus all three is $4,150/year, about the same as Professional Plus, which then adds the other extensions for $50 more. Many drone workflows need less: 3D Analyst alone licenses Cut Fill, Surface Volume, Contour and Slope, and NDVI needs no extension, so Creator plus 3D Analyst ($1,350/year) covers volumes, contours, slope and NDVI. Buy Professional or Professional Plus when you need ArcGIS Pro Standard or Advanced tools, or the ArcGIS Reality for ArcGIS Pro capabilities, which Esri limits to those two user types.
Government and Nonprofit Discounts
Esri has nonprofit, education and government programs, and pricing under them differs from the store’s list prices. Check with your Esri regional office or distributor before you budget.
ArcGIS Pro vs QGIS: Honest Comparison
ArcGIS Pro is not the only option for drone data. QGIS is free, open-source, and improving rapidly.
| Feature | ArcGIS Pro | QGIS |
|---|---|---|
| Cost | $700–4,200/yr per user (Creator to Professional Plus), plus $650/yr per extension on Creator or Professional (Esri US Store list prices, October 2026) | Free |
| Point cloud (LAS/LAZ) | Excellent (native LAS datasets, 3D viewer, analysis tools) | Native LAS/LAZ layers since QGIS 3.18, shown in 2D and 3D views (QGIS docs); fewer analysis tools |
| 3D visualization | Superior (fast, responsive, GPU-accelerated) | Limited (slower, fewer options) |
| Volume calculations | 3D Analyst (Cut Fill, Surface Volume) or Spatial Analyst (Cut Fill) | Built in (Raster surface volume tool for DEM volume against a base level) |
| Client sharing | ArcGIS Online (web-based, no client software needed) | Manual export (GeoJSON, SHP, etc.) |
| Contour generation | Spatial Analyst or 3D Analyst extension | Built-in |
| NDVI / band math | Built-in (Band Arithmetic raster function, ArcGIS Pro Basic) | Built-in (raster calculator) |
| Orthomosaic import | Full support | Full support |
| Format support | Broad (GeoTIFF, CRF, MrSID, ERDAS) | Broader (also COG, VRT, etc.) |
| Learning curve | Moderate | Moderate |
| Industry adoption | Standard in government/enterprise | Growing, still niche |
When to Choose ArcGIS Pro
Choose Pro if your organization already uses Esri, clients expect ArcGIS deliverables, or you need 3D point cloud analysis. ArcGIS Online excels at web-based client sharing. If you’re analyzing multiple point clouds per month, the performance difference justifies the cost.
When to Choose QGIS
Choose QGIS if cost is a barrier, you’re the only user analyzing data, or you mostly work with 2D rasters and vectors. QGIS handles the same core workflows as Pro—contours, NDVI, 2D and 3D point cloud display, DEM volume calculations (the built-in Raster surface volume tool)—but with more manual steps and fewer built-in tools.
Bottom line: ArcGIS Pro wins on 3D visualization, point cloud management, and web-based client delivery. QGIS wins on cost and flexibility. If your clients or organization run Esri, you need ArcGIS Pro. If you’re flying solo and money is tight, QGIS is mature and capable.
FAQ
Q: Do I need Drone2Map if I already process images in Pix4D?
A: No. Drone2Map is redundant if you’re already processing images in Pix4D or Metashape. Process in your current software (you already own it and know how to use it), then import the orthomosaic, point cloud, and DSM into ArcGIS Pro. Drone2Map is only useful if you want to process images inside ArcGIS Pro itself — most operators don’t.
Q: Can ArcGIS Pro handle LAZ files?
A: Yes, through a LAS dataset, from ArcGIS Pro 3.6 on. Create a LAS dataset first (empty container), add your LAZ files to the dataset, build the pyramid, then add the dataset to your map as a layer; individual .laz files can’t be dragged to a map. Esri says direct LAZ use without the LAS dataset is planned for ArcGIS Pro 3.8 (planned for November 2026). On versions before 3.6, convert LAZ to LAS with the Convert LAS tool first; on Creator (ArcGIS Pro Basic) it needs the 3D Analyst or Spatial Analyst extension.
Q: Which ArcGIS Pro license level should I buy for drone work?
A: Price it against what you’ll run. At Esri US Store list prices (October 2026), Creator (ArcGIS Pro Basic) is $700/year and each extension is $650/year; Creator plus 3D Analyst ($1,350/year) licenses Cut Fill, Surface Volume, Contour and Slope, and NDVI needs no extension. Creator plus 3D, Spatial and Image Analyst is $2,650/year. Professional Plus ($4,200/year) bundles those three and five more extensions with ArcGIS Pro Advanced, and makes sense if you need Advanced-level tools or ArcGIS Reality for ArcGIS Pro, which requires Professional or Professional Plus. Drone2Map works with any of Creator, Professional or Professional Plus.
Q: Do I need ArcGIS Online to share results with clients?
A: No, but it’s the easiest way. Without it, you export to GeoJSON or Shapefile and email files to the client. With ArcGIS Online, you publish once and share a link — clients view in browser, no download required, always up-to-date. The user types you buy ArcGIS Pro through are ArcGIS Online user types, so you already have an ArcGIS Online account (Esri’s store lists 500 credits with a Creator license). Hosting draws down credits: 1.2 credits per GB per month for tile and file storage and 2.4 credits per 10 MB per month for feature storage (Esri: credits). Extra credits list at $120 per 1,000 on the US Store. Worth it for client-facing work.
Q: Can ArcGIS Pro calculate volume without the 3D Analyst extension?
A: Not with the standard tools. Surface Volume requires 3D Analyst, and Cut Fill requires 3D Analyst or Spatial Analyst. With neither, you can subtract DSMs with the Arithmetic raster function (Feb DSM − Jan DSM = change map), which works in ArcGIS Pro Basic, but you won’t get automated volume numbers. Buy 3D Analyst ($650/year list) if volume calculations are frequent.
Q: Is ArcGIS Pro better than QGIS for drone data?
A: Depends on your use case. Pro is better for 3D point cloud analysis, real-time client delivery (via ArcGIS Online), and enterprise workflows. QGIS is better for cost and 2D work. If you’re doing both 3D analysis and client delivery, Pro is worth the cost. If you’re mostly doing 2D analysis and keeping results for internal use, QGIS is sufficient.
Q: What happens if I import point clouds with different coordinate systems?
A: ArcGIS Pro handles reprojection automatically if both datasets have defined CRS metadata. But you should explicitly project to a single project CRS before analysis. Some tools require matching coordinate systems. Don’t rely on on-the-fly reprojection — it’s fine for visualization but can cause subtle errors in measurement and analysis.
ArcGIS Pro is the industry standard for drone data analysis and client delivery. Import orthomosaics and point clouds. Run volume calculations, generate contours, detect change. Publish to ArcGIS Online for browser-based sharing.
At Esri US Store list prices (October 2026), expect $1,350/year for Creator plus 3D Analyst, $2,650/year for Creator plus 3D, Spatial and Image Analyst, or $4,200/year for Professional Plus with its bundled extensions. If your organization or clients run Esri, there’s no substitute—you’re in their ecosystem. If cost is prohibitive, QGIS handles most workflows free, but sacrifices 3D performance and cloud-based sharing.
Start with orthomosaics, move to point clouds, then tackle volume calculations and contours. By then, you’ll know if Pro’s value justifies the cost for your work.
Cross-References
- What is an Orthomosaic?
- DSM vs DTM vs DEM: What’s the Difference
- Coordinate Systems for Drone Operators
- Drone Survey Accuracy Explained
- Pix4D vs Metashape vs WebODM: Comparison
- QGIS for Drone Data
- LiDAR vs Photogrammetry
- GSD Calculator Tool
- GCP Calculator Tool