



Updated October 2026: We corrected the wildfire section: NBR needs a shortwave-infrared band that common drone multispectral sensors, including the MicaSense RedEdge and RedEdge-P, don’t have, so the MicaSense burn study we cite (Samiappan et al., 2019) mapped damage with NDVI and a surface model, not NBR; we also added the missing low-severity dNBR class. The same SWIR limit applies to NDMI and to clay and carbonate mineral mapping, so we now attribute those to satellite or SWIR payload data and limit drone mineral work to iron-bearing minerals. We also corrected the NDCI formula to the standard (red edge − red) / (red edge + red), listed the Sentera Double 4K’s actual bands (NDVI is a computed product, not a band), corrected the Pix4Dmapper price to $3,990/year, removed earlier unsourced flight- and processing-time figures and “90% of use cases” claims, and fixed the index chart’s description. November 2026: we removed the sensor price table, which had gone out of date.
Every multispectral drone article you’ve read talks about NDVI and crop health. This one doesn’t.
Multispectral sensors capture wavelengths invisible to the human eye—near-infrared, red edge, thermal—and the applications extend far beyond agriculture. Environmental monitoring, construction inspection, mining compliance, forestry management, and urban planning all use identical sensor technology. What changes is which spectral index you calculate and what question you’re answering.
An RGB camera captures three bands: red, green, blue. A multispectral drone captures 4–10 bands. Each material—water, vegetation, concrete, minerals, living tissue—reflects light differently across these wavelengths. That unique reflection pattern is its spectral signature. Software calculates indices (mathematical ratios between bands) to isolate specific features. The sensor that detects crop health also maps algae blooms, burned vegetation, and some iron-bearing minerals, and with a thermal band added it finds roof leaks.
This article walks through seven non-agricultural applications with real numbers. If you’ve dismissed multispectral as “agriculture tech,” you’re leaving accuracy and money on the table.
What Multispectral Sensors Actually Capture
Before diving into applications, here’s the fundamental difference from your RGB camera.
An RGB drone captures reflected light in three bands of the visible spectrum: red (620–750 nm), green (495–570 nm), blue (450–495 nm). That’s what your eyes see. Multispectral sensors add invisible bands: near-infrared (NIR, 750–1,400 nm), red edge (705–745 nm), and sometimes thermal LWIR (8,000–14,000 nm, i.e. 8–14 µm). Shortwave infrared (SWIR, 1,400–3,000 nm) comes from satellites and specialized payloads, not from the common drone multispectral cameras.
Every material reflects these wavelengths differently. Green leaves absorb red light for photosynthesis but reflect NIR strongly—that’s why vegetation appears bright white in NIR imagery. Water absorbs NIR almost completely, appearing black. Minerals show unique reflectance patterns across SWIR bands. Wet insulation conducts heat faster than dry insulation, showing warmer in thermal images.
Software converts raw reflectance values into indices—normalized ratios between bands. The index highlights the feature you need: vegetation vigor, water presence, burn severity, soil moisture, mineral type. You end up with a map where every pixel represents a single value for that feature. The same sensor produces different maps depending on which index you calculate.
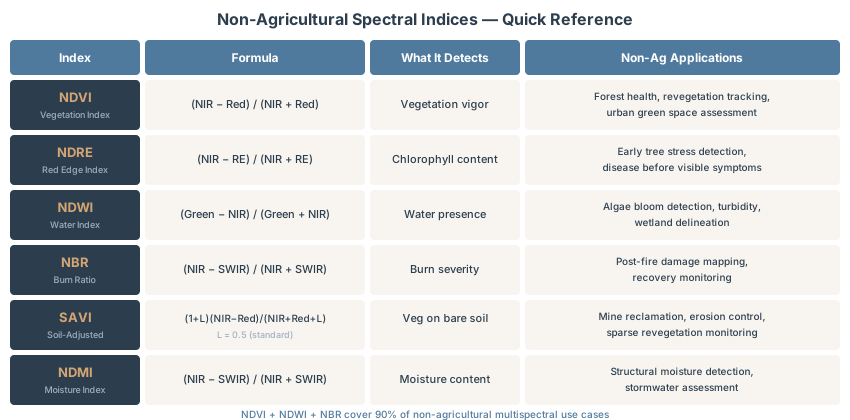
Here are the indices you’ll use most in non-agricultural drone work:
| Index | Formula | What It Detects | Non-Ag Applications |
|---|---|---|---|
| NDVI | (NIR − Red) / (NIR + Red) | Vegetation vigor | Forest health, revegetation tracking, urban green space inventory |
| NDRE | (NIR − Red Edge) / (NIR + Red Edge) | Chlorophyll content | Early tree stress, disease detection before visible symptoms appear |
| NDWI | (Green − NIR) / (Green + NIR) | Water presence and extent | Algae bloom detection, turbidity mapping, wetland delineation |
| NBR | (NIR − SWIR) / (NIR + SWIR) | Burn severity | Post-fire damage assessment and recovery monitoring (needs SWIR: satellite or SWIR payload) |
| SAVI | (1 + L)(NIR − Red) / (NIR + Red + L) | Vegetation on bare soil | Mine reclamation progress, erosion control, sparse revegetation tracking |
| NDMI | (NIR − SWIR) / (NIR + SWIR) | Vegetation and soil moisture | Stormwater and drought planning (needs SWIR: satellite or SWIR payload) |
Each isolates a specific feature. One hardware caveat before you plan around NBR or NDMI: both need a shortwave-infrared (SWIR) band (NBR conventionally uses SWIR2 near 2.2 µm, NDMI uses SWIR1 near 1.6 µm), and the reflectance bands of the common drone multispectral sensors in the hardware section below stop at near-infrared. Those two indices usually come from satellite imagery such as Landsat or Sentinel-2, or from a specialized SWIR payload. Here’s how the indices apply outside agriculture.
Environmental Monitoring: Water Quality and Wetland Delineation
Traditional water quality monitoring relies on boat sampling. Visit a lake or river, collect samples, send them to a lab, wait for results. It’s slow, captures only one location at a time, and misses spatial patterns across the water body.
Multispectral drones change the equation. The University of New Hampshire tested UAV multispectral sensors on freshwater lakes for cyanobacteria blooms—toxic algal growth that kills livestock and sickens humans. Detection effectiveness: over 90%. Data collection and processing took 4.5 times less time than traditional sampling. The key index is the Normalized Difference Chlorophyll Index (NDCI): NDCI = (Red Edge − Red) / (Red Edge + Red). Mishra and Mishra (2012, Remote Sensing of Environment 117: 394–406) defined it with bands at about 708 nm and 665 nm to estimate chlorophyll-a in turbid, productive water. Drone red-edge bands sit at somewhat different wavelengths (717 nm on the MicaSense RedEdge-P, 730 nm on the Mavic 3M), so calibrate against water samples rather than reusing the published coefficients.
Accuracy drops in highly turbid water or extremely concentrated blooms. But for detecting bloom presence and extent before it densifies, multispectral beats traditional sampling on speed and cost.
Wetland delineation—mapping the boundary between water and land—relies on NIR data. Water absorbs NIR almost completely, appearing black. Land reflects NIR, appearing bright. That boundary is sharp. Combined with LiDAR elevation data, multispectral reaches high classification accuracy using Random Forest models. You map physically inaccessible wetlands without wading through them. Regulatory acceptance is strong—federal wetland work increasingly includes drone data.
For invasive aquatic species (water hyacinth, hydrilla, purple loosestrife), deep learning models achieve precision of 0.972 and intersection-over-union of 0.947. Multispectral reveals unique spectral signatures that distinguish invasive plants from native vegetation—impossible in RGB imagery alone.
Wildfire Assessment and Recovery
A wildfire burns 1,000 acres. You need burn severity assessment without sending teams into hazard zones. You need to know which areas burned hot, which survived, and where recovery is fastest.
The standard burn-severity index is the Normalized Burn Ratio (NBR), which uses NIR and SWIR bands:
NBR = (NIR − SWIR) / (NIR + SWIR)
Burned vegetation has low NIR reflectance and high SWIR reflectance—the opposite of healthy vegetation. NBR amplifies this difference. In practice, burn severity mapping uses dNBR (differenced NBR): pre-fire NBR minus post-fire NBR. High positive dNBR values indicate severe burn. Negative dNBR values indicate post-fire regrowth. The USGS (Key and Benson) dNBR classes are: 0.66 and above high severity, 0.44–0.66 moderate-high, 0.27–0.44 moderate-low, 0.1–0.27 low severity, −0.1 to 0.1 unburned, and below −0.1 enhanced regrowth.
Here’s the catch for drone operators: NBR needs a SWIR band, and none of the sensors in the hardware section below has one: not the MicaSense RedEdge-P, nor its predecessor the RedEdge used in the study below. Their reflectance bands stop at near-infrared; the thermal bands on the Altum-PT and Sentera 6X Thermal are long-wave infrared, which NBR doesn’t use. dNBR maps therefore come from Landsat or Sentinel-2 imagery, or from a dedicated SWIR payload, not from a standard drone multispectral camera.
What drone multispectral does well is high-resolution damage mapping with visible, red-edge and NIR indices. In one published example, a MicaSense RedEdge on a small UAS collected about 7.2 km² of five-band imagery after a February 2016 wildfire in a coastal marsh at Grand Bay, Mississippi/Alabama. The team classified burned areas from NDVI and a photogrammetric surface model and compared the result with the Landsat-based Burned Area Reflectance Classification (Samiappan et al., 2019, Drones 3(2): 43). Differenced NDVI and NDRE are the usual drone substitutes for dNBR.
Recovery monitoring tracks the same area over weeks and months, and NDVI measures regrowth as vegetation regenerates. Burn signals also fade as ash weathers and vegetation recovers, so fly as soon after the fire as conditions allow if you want the clearest burned/unburned contrast.
Construction and Infrastructure Inspection
Thermal imaging reveals what RGB cameras cannot see: temperature differences that indicate problems.
Building Envelope Inspection
A flat roof maintains uniform temperature. A roof with water infiltration shows cold spots—water conducts heat faster than dry insulation. Night flights reduce solar noise, making thermal anomalies obvious. A thermal drone collects 30 minutes of imagery and delivers a report highlighting problem areas. Crews target repairs instead of replacing the entire roof. A single inspection often pays for the equipment over 10–15 projects.
Solar Panel Inspection
Traditional I-V curve tracing requires a technician on the roof with meters, testing each string. Time: 2–5 hours per megawatt. A thermal drone inspects in roughly 10 minutes per megawatt. The camera reveals hotspots—cells or strings producing less current and burning excess voltage as heat. Hotspots indicate cell damage, bad soldering, or partial shading degrading output. Detection runs 5–25 times faster than manual work, and you cover an entire farm in a single flight.
Concrete Curing
Thermal imaging detects curing progress within 24–48 hours of placement. Fresh concrete generates heat as it hydrates. Cold spots indicate insufficient hydration; hot spots indicate excess reaction. A contractor adjusts curing protocols, adds heat, or holds concrete longer. This reduces rework and accelerates schedules.
Mining and Quarry Operations
Drone multispectral sensors cover the visible and near-infrared (VNIR, about 0.4–1.0 µm), where iron-bearing minerals such as iron oxides show distinctive features. Carbonates, clays, and phyllosilicates are identified in the shortwave infrared (SWIR, 1.0–2.5 µm), which those cameras don’t record, so that mapping needs a SWIR hyperspectral payload or satellite data. Within those limits, combine multispectral classes with photogrammetry-derived volumes to answer: “What material is in this stockpile and how much?”
Stockpile analysis: Fly the stockpile with RGB to get 3D model and volume in photogrammetry software. Fly again with multispectral and classify pixels where the materials differ in the visible and near-infrared (iron-oxide-rich versus other material, for example). Result: volume split by material class, which you can convert to tonnage with the site’s bulk densities for blend planning and inventory.
Reclamation monitoring tracks revegetation on mined land using NDVI (vegetation vigor), NDRE (chlorophyll content), and SAVI (sparse vegetation on bare soil). SAVI is designed for bare soil work, so it’s more sensitive at early reclamation stages. Regulatory acceptance is strong—the Office of Surface Mining Reclamation and Enforcement accepts drone data for SMCRA compliance. State regulators increasingly require multispectral documentation.
Forestry Management
Forests generate value through timber, carbon offsets, and ecosystem services. Multispectral monitoring quantifies all three.
Blue Normalized Difference Vegetation Index (BNDVI) detects physiological stress before visible symptoms appear. It’s more sensitive than standard NDVI because it isolates blue light reflectance, which shifts earlier in stressed vegetation. A forest manager spots unhealthy trees before insect outbreak or disease becomes visible, enabling early intervention.
Species classification requires more data. Random Forest models trained on multispectral data achieve roughly 78% accuracy for species classification. Deep learning on hyperspectral data (hundreds of narrow bands) achieves 96.2% accuracy but requires significantly more expensive sensors and processing. For operational forestry, multispectral is the pragmatic choice—78% accuracy works for stand-level inventory without the hyperspectral cost.
Canopy density mapping combines multispectral NDVI with LiDAR elevation data. NDVI shows horizontal vegetation extent; LiDAR shows vertical structure (canopy height, layering). The fusion reveals how much vegetation you have and where it sits vertically—critical for stand density, competition stress, and timber volume.
Post-harvest assessment guides reforestation planning. Red edge and NIR bands track recovery speed across cutover areas and identify zones requiring replanting versus zones recovering naturally.
Urban Planning and Green Infrastructure
City planners face one key problem: urban heat islands. Cities are 1–7°F warmer than surrounding areas due to pavement, buildings, and reduced vegetation. The solution involves planting trees, creating green roofs, and installing permeable surfaces. But you can only justify the investment if you quantify the problem.
Satellite thermal imagery has 30-meter resolution. A drone thermal image has 1.5-centimeter resolution. A satellite sees “average temperature in this block.” A drone sees which specific roofs are hot, which parking lots are hot, and which tree canopies are cooling the area. That precision drives targeted green infrastructure investment.
NDVI quantifies vegetation biomass in urban spaces. Object-based classification—grouping adjacent pixels with similar spectral properties—reaches 87% accuracy for separating trees, shrubs, grass, and pavement. Planners use this for tree-canopy reporting, biodiversity assessments, and stormwater planning.
Impervious surface mapping is trickier. Multispectral struggles to distinguish pavement from bare soil because both have similar reflectance. Hyperspectral data or radar (which uses texture, not reflectance) reduces this confusion. For most municipal work, the error margin is acceptable. For precision work, fusion with LiDAR or radar justifies the cost.
Stormwater planning can map vegetation and soil moisture with NDMI (Normalized Difference Moisture Index) from satellite imagery such as Sentinel-2 or Landsat, since drone multispectral sensors lack the SWIR band it needs; drone NDVI then validates bioswale and rain garden vegetation health at much finer resolution. A municipality demonstrates that green infrastructure investments perform as designed—aesthetically and functionally.
Hardware: Which Sensor to Buy
You don’t need custom integration or a $50,000 system to start. Four choices cover most non-ag work:
- Complete drone: DJI Mavic 3M. Four multispectral bands (green, red, red edge, NIR) plus a 20 MP RGB camera, a built-in sunlight sensor and RTK support. It’s the simplest way in. No thermal.
- Low-cost add-on: Sentera Double 4K. A sensor you mount on an existing drone. It has no radiometric calibration hardware, so it suits learning and relative comparisons more than reflectance work.
- Calibrated five-band: MicaSense RedEdge-P. Five bands plus a panchromatic band, used with a light sensor and reflectance panel. Mounts on a DJI Matrice or custom frame.
- Thermal plus multispectral: MicaSense Altum-PT or Sentera 6X Thermal. Both add a long-wave thermal band for building and solar work. Thermal resolution is fine for envelope inspection but below a dedicated thermal drone.
The Parrot Sequoia+ (2016) no longer has a current product page; Parrot offers only support downloads. Skip it for new work.
Processing Software
Raw multispectral data doesn’t become a useful map on its own. You need software that handles multiple bands, calculates indices, and radiometrically corrects pixel values to reflect actual material reflectance (not camera sensor output).
Pix4Dmapper is the industry standard for professional surveys. It computes all indices, handles GCP-based georeferencing, and produces publication-quality orthomosaics. Subscription: $3,990/year, billed yearly, or $332.50/month on the monthly plan (Pix4D pricing page, October 2026); perpetual licensing is no longer advertised by Pix4D. Worth it if you process large areas regularly.
DJI Terra (free with Mavic 3M, or $1,500/year standalone) supports DJI multispectral drones. It calculates NDVI and NDRE, applies radiometric correction via sunlight sensor, and exports GeoTIFF results. Simple and functional for many applications, but limited to DJI data.
OpenDroneMap is free and open-source. Radiometric calibration: use --radiometric-calibration camera+sun flag (available since v0.9.9). Important: process all bands together in one folder—don’t separate them. The software assumes sequential band numbering in filenames. Output is GeoTIFF with reflectance-calibrated pixel values. Good for non-commercial work or proof-of-concept. Processing is slower than Pix4D but acceptable for small-to-medium projects.
QGIS Raster Calculator is free. Once you have GeoTIFFs, QGIS computes any index using band math. NDVI formula: (NIR - Red) / (NIR + Red). Create a new raster where each pixel is the calculation result. The QGIS Raster Indices plugin automates common indices. Not suitable for raw image processing (that needs photogrammetry software), but excellent for post-processing georeferenced data.
ArcGIS Pro offers robust band arithmetic and 160+ built-in raster functions. Image Analyst extension (additional cost) adds supervised classification, deep learning inference, and change detection. Enterprise-grade tool. Standard in organizations already licensing ArcGIS.
For non-agricultural work, Pix4Dmapper is the professional default because it handles radiometric needs and produces defensible deliverables. If budget is tight, OpenDroneMap covers the core workflow (radiometric calibration and reflectance orthomosaics) at zero cost.
FAQ: Non-Ag Multispectral Questions
Q: Do I need a dedicated multispectral drone or can I add a sensor to my existing platform?
Either works. A DJI Mavic 3M is a complete system—simplest approach, zero integration headaches. A MicaSense sensor mounts on a DJI Matrice or custom frame, giving you flexibility for different payloads (multispectral one day, thermal the next, RGB another time). Turnkey systems are simpler; add-on sensors offer more versatility.
Q: Which spectral index should I use for water quality monitoring?
Use NDWI for delineating water bodies and detecting open water extent; it needs green and NIR bands. Use NDCI (Normalized Difference Chlorophyll Index) for algal bloom detection—it tracks chlorophyll concentration. NDCI = (Red Edge − Red) / (Red Edge + Red), so it needs a red and a red-edge band: the Mavic 3M, MicaSense RedEdge-P and Altum-PT and the Sentera Double 4K all have both, while an RGB-plus-NIR camera can only do NDWI.
Q: Can I use multispectral data in QGIS?
Yes. Import bands as separate raster layers, then use Raster Calculator to compute indices. Formula: (layer_nir - layer_red) / (layer_nir + layer_red) produces NDVI. Output is a single-band raster. Free and effective for non-commercial work. For large-scale operations, Pix4Dmapper is faster and handles radiometric correction automatically.
Q: Do I need radiometric calibration panels?
Yes, for quantitative work. Calibration panels (white targets with known reflectance) normalize data across flights and lighting conditions. A Pix4D calibration panel (white, 50×50 cm) costs ~$300. Place it in your flight area, photograph it at mission start, and the software uses it to correct all pixel values. The DJI Mavic 3M has a built-in sunlight sensor that reduces panel need but doesn’t eliminate it. For maximum accuracy in time-series work (comparing this month to next month), use panels.
Q: What about hyperspectral vs multispectral?
Hyperspectral captures 100–400 narrow bands; multispectral captures 4–10 broad bands. Hyperspectral excels at mineral classification and species identification but costs significantly more (sensors: $50,000+), requires heavier platforms, and demands complex processing. Multispectral covers most non-ag work. Use hyperspectral only when multispectral accuracy is insufficient—typically for advanced mineral mapping or high-precision species work.
Pricing Your Multispectral Services
Multispectral services command a premium in non-ag industries because the technology is rarer and the analysis is more specialized.
Small projects (<50 acres): $300–$5,000. Thermal building inspection is your smallest entry—one roof takes 20 minutes.
Medium projects (50–500 acres): $5,000–$15,000. Environmental assessment, mine reclamation monitoring, or forest health survey.
Large projects (500+ acres): $15,000–$50,000+. Regional wildfire assessment, multi-site water quality monitoring, or large mining operations.
Per-acre pricing: $5–$20 for RGB mapping. Add 15–25% premium for multispectral work due to sensor cost and analysis complexity.
Strongest ROI sectors:
- Thermal building inspection: 10–15 projects recover equipment cost.
- Solar farm monitoring: 5–25 times faster than manual I-V testing.
- Mine reclamation compliance: Regulatory requirement, guaranteed demand.
These three are your entry points. Once you have case studies, cross-sell into environmental monitoring and utilities.
Multispectral drones aren’t agriculture technology with side applications. They’re tools for seeing what RGB cameras fundamentally cannot. NDWI for water quality. NDVI change mapping for wildfire. SAVI for revegetation. Thermal for building envelopes. The technology is identical, the sensor platform is standard, and the ROI is proven.
A complete drone like the DJI Mavic 3M puts professional multispectral within reach of any operation. The applications are broader than most operators realize, and the markets are less saturated than agricultural services. If you’ve built expertise in RGB mapping, multispectral is a logical adjacent revenue stream—same flying skills, different analysis.
Start with thermal building inspection or solar farm monitoring. Quick payback. Clear ROI. Existing demand. Once you have one application running, expand.
Cross-Links
- LiDAR vs Photogrammetry: When to Use Each
- Drone Survey Accuracy Explained
- QGIS for Drone Data: Complete Workflow
- Pix4D vs Metashape vs WebODM vs RealityScan
- DSM vs DTM vs DEM Explained
- What Is an Orthomosaic?
- GSD Calculator Tool
- GCP Calculator Tool
References
Research and standards cited in this article.
- Key, C. H., & Benson, N. C. (2006). Landscape assessment (LA): Sampling and analysis methods. In D. C. Lutes et al., FIREMON: Fire effects monitoring and inventory system (Gen. Tech. Rep. RMRS-GTR-164-CD, pp. LA-1–LA-55). USDA Forest Service, Rocky Mountain Research Station. doi:10.2737/RMRS-GTR-164
- Mishra, S., & Mishra, D. R. (2012). Normalized difference chlorophyll index: A novel model for remote estimation of chlorophyll-a concentration in turbid productive waters. Remote Sensing of Environment, 117, 394–406. doi:10.1016/j.rse.2011.10.016
- Samiappan, S., et al. (2019). Remote sensing of wildfire using a small unmanned aerial system: Post-fire mapping, vegetation recovery and damage analysis in Grand Bay, Mississippi/Alabama, USA. Drones, 3(2), 43. doi:10.3390/drones3020043