



Updated November 2026: Added a worked section on ellipsoid vs geoid heights, with a real GEOID18 lookup, the sign rules for the US and Britain, and step-by-step fixes in Metashape and QGIS. October 2026: We rewrote Cause 1. A height-system or datum mismatch shifts the whole model by a near-constant amount: roughly 8 to 39 m for ellipsoidal versus orthometric heights, under 2 m for a datum or antenna-height error. It can’t produce a sag only between the GCPs, so that pattern is now attributed to Causes 2–4. Doming is now attributed to radial-distortion mis-estimation (James and Robson 2014). We also corrected the ASPRS checkpoint requirement (at least 30, with no small-project exception) and updated the figure descriptions to match the revised graphics.
A pilot flies the same site every month. Same drone, same Dronelink mission, same Emlid Ground Control Point (GCP) markers in the same hat-marked spots. Eleven flights produced clean deliverables. The twelfth came back a meter low — but only away from the GCPs. Walk a checkpoint near a control marker, elevation reads correctly. Walk fifty feet into the field, the surface drops a meter underfoot. Same hardware, same workflow, same site, different answer.
This is vertical bias — the failure GCPs were supposed to prevent, and the one GCPs alone cannot diagnose.
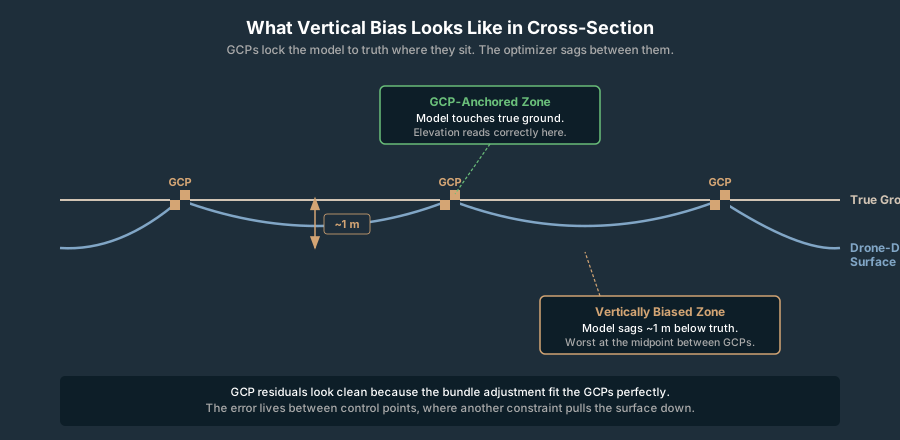
What Vertical Bias Actually Is
Vertical bias is a systematic offset in elevation across all or most of a photogrammetric model. Every elevation reads consistently high — or consistently low — by roughly the same amount. It is not random noise. It is not the curved arc of the doming effect. It is a flat directional shift, as if someone slid the entire surface down 0.8 meters and called it done.
In a quality report, vertical bias shows up as a non-zero mean of the Z residuals at your checkpoints. Random error has a mean near zero — positive and negative residuals cancel. A bias does not cancel. The whole population is shifted.
Read the mean Z residual paired with the standard deviation. Vertical Root Mean Square Error — vertical RMSE (RMSEV) — bundles both into one number. Convenient for RMSE reporting, useless for diagnosis. A 0.9 m mean with 0.05 m standard deviation is a different problem from a 0.0 m mean with 0.9 m standard deviation, and they require different fixes. Doming and vertical bias produce identical RMSEV numbers while needing opposite responses.
The trap with this failure mode — fine at the GCPs, off everywhere else — is that the GCP residuals look clean. Bundle adjustment fitted the GCPs perfectly because that is what bundle adjustment does. The error lives in the gaps between control points, where the optimizer compromised between the truth your GCPs encoded and a bad constraint from somewhere else in the dataset. Štroner and colleagues (2021, “Photogrammetry Using UAV-Mounted GNSS RTK: Georeferencing Strategies without GCPs,” Remote Sensing) measured systematic elevation errors as large as 0.85 m, nearly 30× the 0.03 m GSD, on RTK-only flights with no GCPs in the bundle, and showed the error tracked focal-length drift in the self-calibration.
That is the gap this article fills. GCPs are necessary for accurate vertical, not sufficient. When they fail to save you, the question is not whether to add more — it is which constraint in the bundle adjustment is fighting them.
How to Read the Failure in the Quality Report
Before walking the diagnostic tree, pull the report and triage. Three numbers do most of the work.
GCP Z residuals. These should be sub-centimeter. If they are not, your GCP coordinates do not match your image network — focus there before anything else.
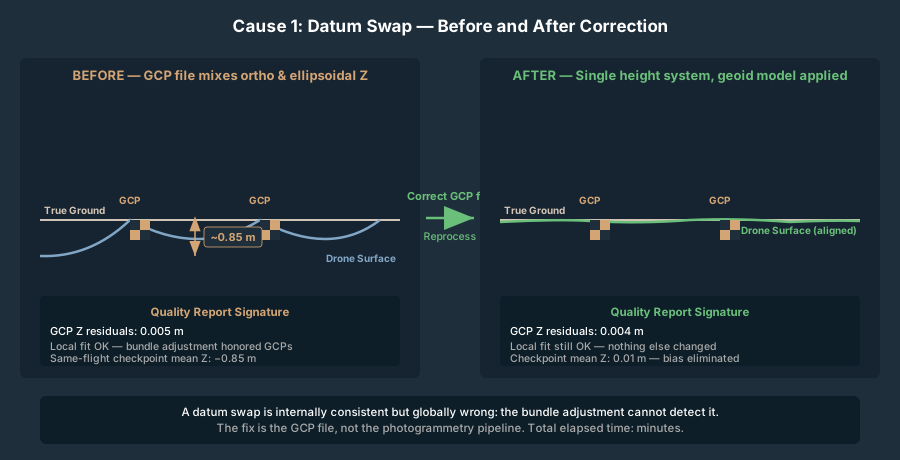
Checkpoint Z residuals. These are the real accuracy. If GCP Z is 0.005 m and checkpoint Z mean is 0.85 m, the model is locally correct and globally wrong. That is the signature pattern.
Camera Z bias. Most quality reports include an “estimated vs initial” comparison for the cameras. If your initial Exchangeable Image File Format (EXIF) altitudes were 122 m and the optimizer pushed them to 115 m, that 7-meter swing is the bundle adjustment fighting your GCP block.
Pix4D’s quality report frames the Z residual as original position − computed position, so a positive mean residual means the surveyed checkpoint sits above the model — the model is biased low. That sign convention varies between vendors; confirm yours before drawing conclusions. The drone mapping quality report breakdown walks through the per-image and per-GCP tables in more detail.

The Diagnostic Decision Tree
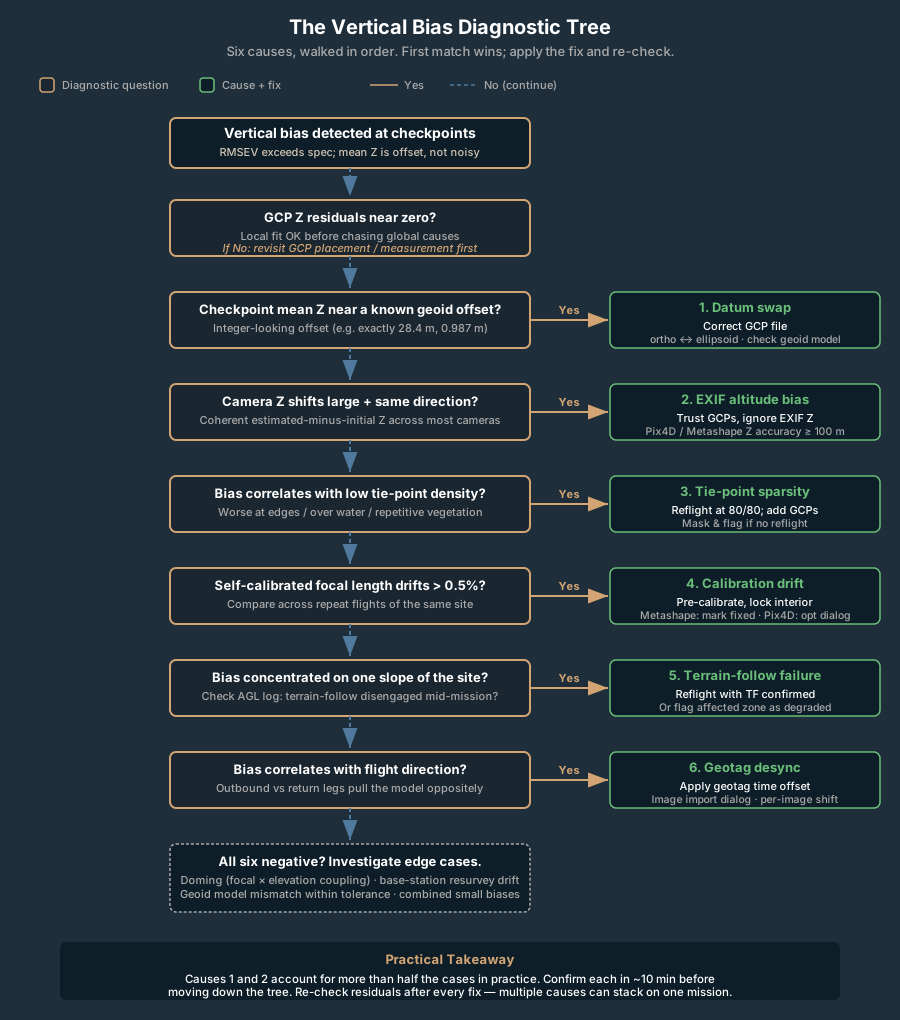
Six causes account for nearly every vertical-bias failure on a properly configured GCP-controlled mission. Walk them in order — the first two cause more than half the cases practitioners report, and they take ten minutes each to confirm.
1. Vertical Datum Swap in the GCP File
Failure signature. GCP Z residuals near zero. Checkpoint Z residuals clustered tightly around a near-constant mean offset, the same near the GCPs as between them. The model is internally consistent; it is fitted to GCP heights in a different vertical system from your checkpoints (or your deliverable spec), so the whole surface sits at the wrong elevation. This cause does not produce the “fine at the GCPs, sagging between them” pattern in the opening example. A height-system mismatch moves the GCPs and the surface together, so it shifts the whole model uniformly. A sag confined to the gaps between control points comes from Causes 2–4 below.
Why this happens. The size of the offset tells you which mismatch you have.
- Roughly 8 to 39 m: ellipsoidal vs orthometric heights. Your GCPs were collected one month in NAVD88 orthometric heights. The next month they came back from the survey pipeline as ellipsoidal heights from the GNSS receiver, and your processing software assumed orthometric. The offset is the local geoid separation. In the lower 48 that ranges from about −8 m around Yellowstone in Wyoming to about −39 m on the North Carolina coast, and is more negative offshore (NGS, GEOID18). That’s roughly 8 to 39 m, never one or two.
- Under 2 m: vertical datum or antenna height. A near-constant offset of a metre or so points to a vertical-datum mismatch, such as one height set in NGVD29 and the other in NAVD88. The two differ by about −0.5 m to +1.5 m across the lower 48, depending on location (NGS NCAT/VERTCON). It can also point to an antenna-height error: a rod height left out, entered twice, or measured as a slant height.
A second flavor: the Real-Time Kinematic (RTK) base was resurveyed between flights and the operator did not update the project. If the base station’s published height shifts, every GCP coordinated against that base shifts with it, by the same amount.
How to confirm. Open the GCP file. Compare one GCP’s Z value against the surveyed value in your project records, and compare the checkpoint mean offset against the local geoid height (NGS’s GEOID18 tools give it for any latitude and longitude). An offset that matches the local geoid height, for example 28.4 m, means ellipsoidal versus orthometric. An offset under 2 m, for example 0.987 m, points to a datum or antenna-height problem. Check the receiver’s height output mode (orthometric vs ellipsoidal), the geoid model selected in post-processing, the antenna and rod heights recorded for each point, and the vertical component of the project CRS in your photogrammetry software. The coordinate systems primer walks through the geoid-vs-ellipsoid distinction in field-usable terms, and the worked GEOID18 example below runs the arithmetic and the fix for one real coordinate.
Fix. Convert the GCP file to the same vertical system as the checkpoints and the deliverable. Reprocess. Done.
2. EXIF GPS Altitude Bias on a Non-RTK Drone
Failure signature. GCP Z residuals near zero. Checkpoint Z residuals trending in the same direction as the EXIF-to-solution camera Z shift. Camera Z shifts visible in the report — often 5 m to 50 m. Effect strongest in the middle of the block, weaker near GCPs.
Why this happens. Consumer and pro-sumer drones use barometric altimeters cross-referenced against single-frequency GPS. Barometric readings drift with atmospheric pressure through the flight. Barometer-based altitude is typically accurate to within roughly 10 feet (3 m), but drift accumulates on longer missions — operator field reports document drift exceeding 10 m on hour-long flights. The bundle adjuster reads the EXIF GPS altitude on every image and uses it as a soft constraint on camera Z. If those altitudes are biased low by 30 m, the optimizer compromises: pulls the cameras up toward the GCP-implied truth, pulls the surface down toward the EXIF-implied truth. Result: fine at the GCPs, biased low between them.
Štroner et al. (2021) make a useful contrast. On their RTK-only flights the recorded camera heights matched the adjusted ones (mean difference zero), so camera height was not the problem; the vertical error came from focal-length drift instead. That pattern points to Cause 4, not this one.
How to confirm. In the quality report, look at the camera position adjustments. If estimated minus initial Z is a coherent shift in one direction across most or all cameras (not random scatter), EXIF is fighting the GCPs. The magnitude of the camera shift will roughly match the magnitude of the surface bias.
Fix. Three options, in order of effort. (1) In Pix4D, set image geolocation accuracy to a very large number for Z, or disable the EXIF altitude entirely — this tells the optimizer to trust GCPs and ignore EXIF altitude. In Metashape, set camera location accuracy in Z to 100 m or more. In OpenDroneMap (ODM), raise --gps-accuracy to a large value (e.g., 100) so the optimizer weights GCPs over EXIF, or use --gps-z-offset to apply a known altitude correction; avoid --force-gps unless your EXIF positions are reliable. (2) Reflight with RTK if available. (3) Pre-correct the EXIF altitudes against a known reference before processing.
3. Sparse Tie-Point Coverage Away From GCPs
Failure signature. GCP Z clean, checkpoint Z residuals worsen with distance from the nearest GCP, model edges and corners noticeably worse than center. Tie-point density map from the report shows thin coverage in the affected zone.
Why this happens. Bundle adjustment propagates GCP control through the tie-point network. If a region has few or low-quality tie points — repetitive vegetation, water, snow, deep shadow, a freshly graded dirt pad — the optimizer cannot transfer the GCP constraint into that zone. The surface there is anchored only by the EXIF camera positions and the tie-point geometry, both of which carry vertical error.
The doming effect article covers the related geometric failure where the entire surface bows because self-calibration mis-estimates radial lens distortion from near-parallel nadir images (James & Robson 2014). Sparse-tie-point bias is the simpler cousin: not a global bow, just a regional miss.
How to confirm. Pull the dense tie-point map from the report. Overlay your checkpoint locations. Bias zones tend to land in low-tie-point regions. Cross-reference with the orthomosaic — repetitive textures and water are the usual culprits.
Fix. Increase overlap on the next flight; target 80/80 minimum on featureless terrain. Add GCPs in the low-tie-point zones if reflyable. For an existing dataset with no extra control, mask the low-tie-point regions in the deliverable and flag them as estimated rather than measured.
4. Camera Self-Calibration Drift Between Flights
Failure signature. GCP Z clean, checkpoint Z biased, the bias amount varies between repeat flights of the same site even when the workflow is unchanged. Estimated focal length differs flight-to-flight by more than 0.5 percent.
Why this happens. When a photogrammetry pipeline runs self-calibration, it estimates focal length, principal point, and distortion coefficients per dataset. Focal length and camera Z are mathematically correlated during the bundle adjustment — a small focal-length error propagates directly into vertical bias because the optimizer can trade one for the other. Temperature, mechanical shock, and a recently swapped lens can all shift the actual interior orientation between flights. Thermal focal-length drift in image-sensor cameras is well-documented during ambient temperature swings — non-trivial for sub-meter vertical work.
How to confirm. Compare the estimated focal length, principal point, and radial distortion coefficients across recent flights of the same hardware. A self-calibration that is reasonably stable (focal length within 0.1 percent) across flights points elsewhere; a self-calibration that drifts is your problem.
Fix. Pre-calibrate the camera against a calibration target and lock the interior orientation in the photogrammetry software (in Metashape, mark the calibration parameters as fixed; in Pix4D, use the camera optimization parameters dialog). Reprocess with the locked calibration. The trade-off: a fixed calibration that no longer matches the actual lens (e.g., after temperature swings or a hard landing) introduces its own bias. Mid-mission temperature monitoring or pre-flight calibration shots help bound the risk.
5. Terrain-Follow Failure Mid-Mission
Failure signature. Vertical bias concentrated on one slope of the project, often the steepest. Checkpoint Z residuals correlate spatially with elevation change. GCP locations on the well-mapped slopes look fine; the off-slope half is biased.
Why this happens. Terrain-follow modes plan the mission against a Digital Elevation Model (DEM) — typically SRTM or ASTER — and command the drone to follow the surface at constant Above Ground Level (AGL). If terrain-follow disengages mid-flight (DEM coverage gap, signal loss, manual override, drone reverting to Mean Sea Level (MSL) after a battery swap), the second half of the flight runs at constant MSL, varying Ground Sample Distance (GSD) and overlap with topography. The result is uneven tie-point density, uneven GCP-network coverage on slopes, and a model that fits cleanly where the flight executed correctly and biases where it did not. Check your flight app’s log for the terrain-follow engagement state (DJI Pilot 2 and Dronelink both expose this) to confirm it stayed active for the whole mission.
How to confirm. Pull the actual flight log. Plot drone AGL across the mission. Constant AGL through the whole flight means terrain follow worked. AGL diverging from terrain mid-flight means it didn’t. The bias zone matches the flight half where AGL drifted.
Fix. Reflight the affected zone with terrain follow confirmed engaged. If reflight is not an option, treat the affected zone as a known-degraded deliverable.
6. Image Timestamp / GPS Desync (Geotag Offset)
Failure signature. Bias correlated with flight direction. Cameras on the outbound leg pull the model one way; cameras on the return leg pull the other. RMSEV dominated by direction-dependent residuals.
Why this happens. The drone’s GPS receiver and camera shutter operate on different clocks. If they are out of sync by 0.5 seconds at 22 mph (10 m/s) ground speed, every image is geotagged 5 m from where it actually fired. The bundle adjuster gets a geotag track shifted along the flight direction — and altitude shifts with it because flight paths are rarely perfectly level over hilly terrain. Desync bias is usually horizontal, but on terrain with vertical change it bleeds into Z.
How to confirm. Compare the geotag track against the actual flight path log. A persistent forward or backward offset means desync. Many DJI drones apply a small built-in geotag time correction; check the manufacturer’s release notes or test against a ground reference for your specific model.
Fix. Apply a per-image geotag offset in the photogrammetry software. Pix4D and Metashape both support time-shift corrections in the image import dialog.
Diagnostic Decision Tree at a Glance
| Cause | Quick Confirm | Typical Fix |
|---|---|---|
| Vertical datum swap | Near-constant offset everywhere: tens of m = ellipsoidal vs orthometric; under 2 m = datum or antenna height | Correct GCP file, reprocess |
| EXIF altitude bias | Coherent camera Z shift in report | Disable EXIF altitude weight, or reflight with RTK |
| Tie-point sparsity | Low-tie-point regions overlap bias zones | More overlap, more GCPs in gaps |
| Calibration drift | Focal length differs between flights | Lock pre-calibrated camera parameters |
| Terrain-follow failure | Drone AGL drifts mid-flight in log | Reflight with terrain follow confirmed |
| Geotag desync | Bias correlates with flight direction | Apply time-shift correction in import |
Ellipsoid vs Geoid Heights: Fixing a Vertical Datum Mismatch
Cause 1 is the only cause on this list that you can fully diagnose with arithmetic. A DEM sitting tens of meters off from the GCPs it was built against is the classic symptom: somewhere in the chain, one dataset carries ellipsoidal heights and the other carries orthometric heights. This section works one site through end to end: the numbers, the sign, and the fix in Metashape and QGIS.
The two heights. An ellipsoidal height (h) is what GNSS measures: distance above a smooth mathematical ellipsoid (GRS80 for NAD83(2011)). An orthometric height (H) is an elevation: distance above the geoid, the gravity surface that approximates mean sea level, which in the US means NAVD88. The geoid height (N) is the gap between the two surfaces. NGS states the relationship as h = H + N, so H = h − N (Milbert and Smith, NGS, “Converting GPS Height into NAVD88 Elevation”). The coordinate systems primer covers the concepts; what matters here is the sign.
The sign flips with geography. Across the conterminous US the geoid sits below the ellipsoid, so N is negative and ellipsoidal heights read lower than elevations. NGS’s own example: near the shore, a point at +1 m orthometric can sit at about −30 m ellipsoidal. GEOID18 values from the NGS Geoid Height Service run from −7.6 m (44° N, 110° W, Yellowstone) to −39.0 m (35.9° N, 75.6° W, the North Carolina Outer Banks) over land. Britain is the opposite. Ordnance Survey’s A Guide to Coordinate Systems in Great Britain puts the GRS80 ellipsoid about 50 m below the geoid there, so ellipsoidal heights read higher than Ordnance Datum Newlyn (ODN) heights. The OSGM15 grid gives separations of about 45.4 m at Greenwich and 53.0 m at Penzance. Watch the letters too: the OS guide writes ellipsoid height as H and orthometric height as h, the reverse of the NGS convention.
To put it plainly: in the US, a surface that is too low by 8 to 39 m is a height-type mix-up. In Britain, a surface that is too high by 45 to 53 m is the same mistake. Land DEM values below zero are another giveaway, since coastal ellipsoidal heights in CONUS are often negative.
Worked Example: GEOID18 on the National Mall
Here is one site worked through: the National Mall in Washington, D.C., at 38.889484° N, 77.035278° W (NAD83(2011)). The NGS Geoid Height Service (the GEOID18 computation tool has the same model behind a web form) was queried on 2 November 2026.
| Quantity | Value | How it was obtained |
|---|---|---|
| GEOID18 geoid height N | −32.088 m (±0.028 m) | NGS Geoid Height Service, GEOID18 |
| Same point through PROJ 9.8 | h = 0.000 m → H = +32.088 m | EPSG:6319 to EPSG:6349 using the us_noaa_g2018u0.tif grid |
| N at three points about 1 km away | −32.068, −32.094, −32.102 m | NGS Geoid Height Service, GEOID18 |
| Spread across these four points | 3.4 cm | Max minus min of the four values |
Take a GCP surveyed at H = 5.000 m NAVD88. Its ellipsoidal height is h = H + N = 5.000 + (−32.088) = −27.088 m. If the GCP file holds −27.088 m and the project treats it as NAVD88, the whole model sits 32.09 m low, and every checkpoint shows that offset to within a few centimeters. Those few centimeters matter. Across a typical drone site the geoid height barely moves, so a height-type mismatch produces a near-constant offset whose size equals the local N. An offset that changes by meters across the site is not a geoid problem. Go back to Causes 2–6.
The test. Look up N at the site center. Compare it with the mean checkpoint offset, model minus truth. In the US, a model that is low by |N| means ellipsoidal heights went in where orthometric heights belonged. A model that is high by |N| means the reverse: the geoid was subtracted twice, or orthometric GCPs were loaded into an ellipsoidal project. An offset within a few decimeters of |N| is a strong match. The leftover is often the WGS84 vs NAD83(2011) height difference covered in the primer.
Fixing It in Metashape
By default Metashape Professional expects every camera and marker altitude to be an ellipsoidal height. It treats altitudes as heights above the geoid only when a compound coordinate system is selected in the Reference pane settings (Agisoft Metashape Professional 2.3 user manual, “Using different vertical datums”). Geoids are a Professional-edition feature, and only EGM96 ships with the installer.
- Install the geoid grid. Download “Geoid 18, Conterminous United States”, listed as NAD83(2011) (EPSG::6318) to NAVD88 height (EPSG::5703), from Agisoft’s geoids page (file us_noaa_g2018u0.tif). Copy it into the geoids folder in the Metashape installation directory and restart. For Britain, the same page lists OSGM15: ETRS89 (EPSG::4258) to ODN height (EPSG::5701).
- Set the chunk system. Click Settings on the Reference pane toolbar. In the Reference Settings dialog, pick the deliverable’s compound system in the first Coordinate System dropdown, for example NAD83(2011) / UTM zone 18N + NAVD88 height (EPSG:6347+5703 in PROJ terms).
- Describe the source data honestly. The same dialog lets you give cameras and markers their own coordinate systems. If the GCPs came off the receiver as ellipsoidal heights, set the marker system to the plain NAD83(2011) system and let Metashape apply GEOID18. If they are NAVD88 elevations, set the marker system to the compound system. Most mismatches start here: an ellipsoidal file loaded under an orthometric label.
- Re-run the adjustment and check. Apply the settings, update the reference, run Optimize Cameras, and re-read the checkpoint mean. It should collapse from about |N| to centimeters. The Reference pane’s Convert button re-expresses existing camera and marker coordinates in another system if you need the GCP table itself in NAVD88.
- Embed the geoid for handoff. Tools ► Geoids… lists the installed geoids. Embed Geoids saves the grid inside the project (.psx only), so a colleague’s machine doesn’t need its own copy.
If Metashape reports “Vertical datum out of range”, some of the data falls outside the geoid grid. GEOID18’s conterminous grid covers 24–58° N and 60–130° W (NGS).
Fixing It in QGIS (GDAL/PROJ)
QGIS 3.38 added a vertical CRS setting under Project Properties ► Elevation. The QGIS 3.38 changelog says it “does not impact rendering or feature handling and is currently a metadata property only.” Setting it labels the DEM. It doesn’t change a single height. To change the values, run the DEM through GDAL, which hands the geoid lookup to PROJ.
Geographic DEM (lat/long cells, ellipsoidal heights). From the OSGeo4W Shell or any terminal with GDAL:
gdalwarp -s_srs EPSG:6319 -t_srs EPSG:6349 dem_ellipsoidal.tif dem_navd88.tif
EPSG:6319 is NAD83(2011) 3D, so the heights are declared ellipsoidal. EPSG:6349 is NAD83(2011) + NAVD88 height. The gdalwarp docs say a vertical shift is applied automatically when one side is a compound or 3D CRS and the raster has a single band. PROJ resolves this pair to EPSG transformation 9229, “NAD83(2011) to NAVD88 height (3)”, which reads us_noaa_g2018u0.tif.
Projected DEM (UTM or State Plane cells). A 2D projected source CRS doesn’t say the heights are ellipsoidal. Passing EPSG:6347 to EPSG:6347+5703 through PROJ 9.8 returned the input height unchanged, with no correction at all. Spell the pipeline out and force the shift:
gdalwarp -s_srs EPSG:6347 -t_srs EPSG:6347+5703 -vshift \
  -ct "+proj=pipeline +step +inv +proj=utm +zone=18 +ellps=GRS80 +step +inv +proj=vgridshift +grids=us_noaa_g2018u0.tif +multiplier=1 +step +proj=utm +zone=18 +ellps=GRS80" \
  dem_ellipsoidal.tif dem_navd88.tif
That pipeline returned H = 32.088 m for h = 0 at the National Mall point, which matches NGS. Swap the UTM step for your State Plane definition as needed. In QGIS’s Processing Toolbox the same job is GDAL ► Raster projections ► Warp (reproject), with the flags in “Additional command-line parameters.”
The silent failure. If PROJ can’t find the grid, it doesn’t stop. With network access off and no local grid, PROJ 9.8 picked a “ballpark vertical transformation, without ellipsoid height to vertical height correction” and returned the input height unchanged. You get no error (at most a console warning that’s easy to miss) and no shift, and the output looks fine until a checkpoint disagrees by 32 m. Fetch the grid first with projsync --file us_noaa_g2018u0.tif, or set PROJ_NETWORK=ON so PROJ streams it from cdn.proj.org. In QGIS’s datum transformation dialog, operations that need a missing grid appear greyed out with a download button (QGIS User Manual, “Datum Transformations”). Untick “Allow fallback transforms if preferred operation fails” when height matters.
Sanity-check before warping a whole DEM. PROJ’s command-line tools take EPSG:6319 coordinates in latitude, longitude order:
echo 38.889484 -77.035278 0 | cs2cs EPSG:6319 EPSG:6349
A height near 32.09 means the grid is in play. A height of 0 means you’re on the fallback.
Vertical Datum Mismatch Checklist
- Write down the height type at every hand-off. Receiver output, PPK export, GCP CSV, photogrammetry project, DEM export. “Elevation” isn’t a height type. “NAD83(2011) ellipsoidal” and “NAVD88 (GEOID18)” are.
- Look up N at the site center. Use the NGS GEOID18 tool, or OSGM15 in Britain. Write the number in the project notes.
- Compare the checkpoint mean offset with |N|. Within a few decimeters and near-constant across the site means a height-type mismatch. Under 2 m means a datum or antenna-height problem (Cause 1 above). Anything that varies across the site goes to Causes 2–6.
- Check the sign. In CONUS, a model low by |N| took in ellipsoidal heights as elevations. A model high by |N| applied the geoid twice.
- In Metashape, match the marker CRS to the GCP file, not to the deliverable. Let the chunk’s compound CRS carry NAVD88.
- In QGIS, convert with GDAL, not with the vertical CRS setting. The setting is a label.
- Prove the grid loaded. Run one known point through
cs2csor the NGS tool before trusting a converted DEM. - Deliver with the full vertical description. Vertical datum, geoid model and EPSG codes go in the metadata, and the .psx gets the geoid embedded.
What To Do TONIGHT If This Is Happening
When the deliverable is due tomorrow and the model is a meter low, walk this fast checklist before opening any new processing run.
- Pull the quality report. Read GCP Z residuals, checkpoint Z residuals, camera position shifts. Two minutes.
- Compare the GCP file Z values against your survey field book. Datum swaps are visible at this layer. Five minutes.
- Check the camera Z shift in the report. A coherent direction of EXIF-vs-solution shift larger than 5 m is your suspect. Two minutes.
- Pull the flight log and confirm constant AGL through the mission. Terrain-follow drops show up here. Three minutes.
- Check focal length against the previous flight’s report. Drift over 0.5 percent is meaningful. Two minutes.
- Run a checkpoint elevation extraction at five spots: one near each GCP corner and one at the center. A clean GCP-vicinity number with a biased center number confirms the trigger pattern.
Fifteen minutes total. If none of those steps surfaces a cause, you are in the long tail — geotag desync, atmospheric refraction, or a multi-cause combination. Reprocess with EXIF altitude weighting reduced to break the most common silent failure first, then triage from there.
When To Stop Trusting GCPs and Reflight
Three conditions trigger a reflight rather than a reprocess.
Tie-point coverage is below 50 images per ground point in the bias zone. No amount of GCP work will fix a model that did not have the imagery to support it. More overlap on the next flight is the only path forward.
Focal length is drifting flight-to-flight by more than 1 percent. The camera has a mechanical or thermal stability problem. Pre-calibration, lens replacement, or a different drone for vertical-critical work is the right call.
Terrain-follow disengagements are happening repeatedly on the same site. The DEM your planner is using does not match the ground. Custom DEM import or physical site survey to seed the planner solves it.
Checkpoint validation is the truth-teller in all six failure modes. Without independent checkpoints, none of these biases are visible until a third party walks the site with an RTK rover. The American Society for Photogrammetry and Remote Sensing (ASPRS) Positional Accuracy Standards for Digital Geospatial Data (Edition 2, 2023; Edition 2, Version 2 adopted in 2024) require at least 30 independent checkpoints for a compliant accuracy assessment. The count rises with project area and is capped at 120. There is no small-project exception: a test with fewer than 30 checkpoints doesn’t meet the standard; ASPRS says its results should be reported with the statement “…this test was performed using ONLY __ checkpoints.” For a quick diagnostic, six well-placed checkpoints at center, edges, and corners catch every failure mode in this article.
GCPs are necessary for vertical accuracy. They are not sufficient. When the model is biased everywhere except around the control markers, the GCPs are doing their job — and the bundle adjustment is fighting another constraint that is just as influential and twice as easy to overlook.
The two highest-yield checks: vertical datum on the GCP file, and EXIF altitude bias in the camera positions. Those account for the majority of vertical-bias cases (the datum check catches uniform offsets; the EXIF check catches the sag between GCPs), and both are confirmable in under ten minutes from the quality report and the GCP source file. Walk the rest of the tree only after those are clean.
A model that fits the GCPs perfectly is not the same as a model that fits reality. The checkpoints tell you which.
References
Research and standards cited in this article.
- ASPRS. (2024). ASPRS positional accuracy standards for digital geospatial data (Edition 2, Version 2.0). American Society for Photogrammetry and Remote Sensing. doi:10.14358/ASPRS.PAS.2024
- James, M. R., & Robson, S. (2014). Mitigating systematic error in topographic models derived from UAV and ground-based image networks. Earth Surface Processes and Landforms, 39(10), 1413–1420. doi:10.1002/esp.3609
- Milbert, D. G., & Smith, D. A. (1996). Converting GPS height into NAVD88 elevation with the GEOID96 geoid height model. National Geodetic Survey. link
- Ordnance Survey. (2020). A guide to coordinate systems in Great Britain (Version 3.6). Ordnance Survey. link
- Štroner, M., et al. (2021). Photogrammetry using UAV-mounted GNSS RTK: Georeferencing strategies without GCPs. Remote Sensing, 13(7), 1336. doi:10.3390/rs13071336